November 26, 2020
How to Create U.S. Electoral Cartograms
Alteryx
,
cartogram
,
Donald Trump
,
election
,
electoral college
,
Joe Biden
,
map
,
Noah Veltman
,
polygon
,
shape
,
United States
,
USA
,
workflow
No comments

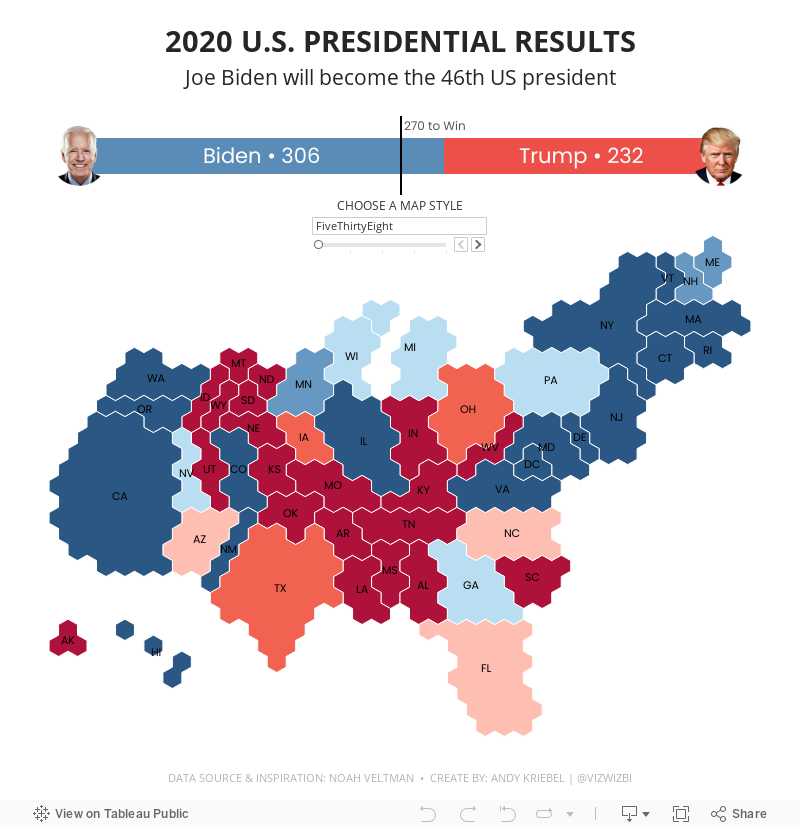
I don't remember how I came across the set of cartograms I'm going to show you how to create. Alas, I wanted to recreate this mesmerising set of cartograms that Noah Veltman created based on election maps from various media outlets.


Once I had the CSV, it was pretty easy to build in Tableau.
- X on the Columns
- Y on the Rows (and reverse the axis)
- Set both X and Y to AVG
- Change the mark type to Polygon
- Add the Path field to the Path shelf (this tells table how to connect the edges of the polygon)
- Add the State field to the Detail shelf
From there, it was some formatting for the colors, etc. This process, I would think, would work for any SVG (vector) file. This was a fun little project. I learned a lot!
Subscribe to:
Post Comments
(
Atom
)

No comments
Post a Comment