December 6, 2017
Workout Wednesday: Position of Letter Occurrences in Baby Names
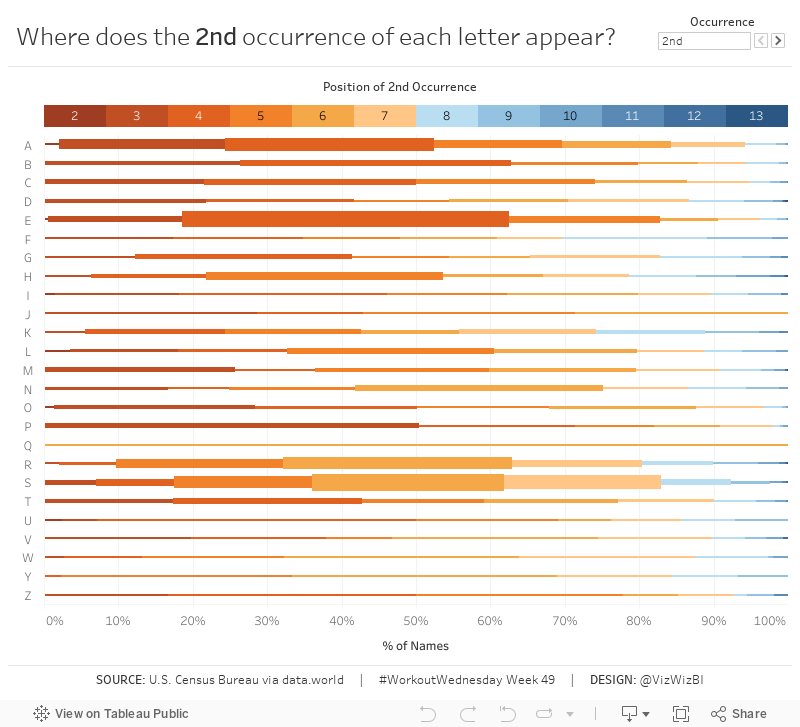
Using this data set of names from the 1990 U.S. census (via data.world), build the same viz that you see below based on this set of requirements:
- The letter down the left is the first letter of the name.
- Determine the % of total times that a letter appears in the nth position of the names. In other words, the letter A appears in the 2nd position in 27 names, which represents 2.1% of names starting with the letter A.
- The viz should NOT display the % of times the letter appears in the first position.
- The % of total display should be sized by the number of names in which the letter appears in each position.
- The scale should show at 10% increments.
- Match the tooltip.
- When you click on a letter/position combination, those names should appear in a table below the chart. The table layout must look like mine.
- Notice how the names in the table are small. This helps them fit better (but not perfectly).
- Match my tooltips on the names table.
- When you deselect a letter/position combination, the table should disappear.
- Create a legend above the chart that reflects the possible positions of the nth occurrence.
- Match the colors on the legend, which should match the colors in the chart.
- When you click on a position in the legend it should highlight that position throughout the chart.
- Match my tooltips on the legend.
- The user must be able to select the nth occurrence they want to view. The options should be 2nd, 3rd or 4th and should look like mine.
- The title must update dynamically to reflect the nth occurrence selected.

August 13, 2017
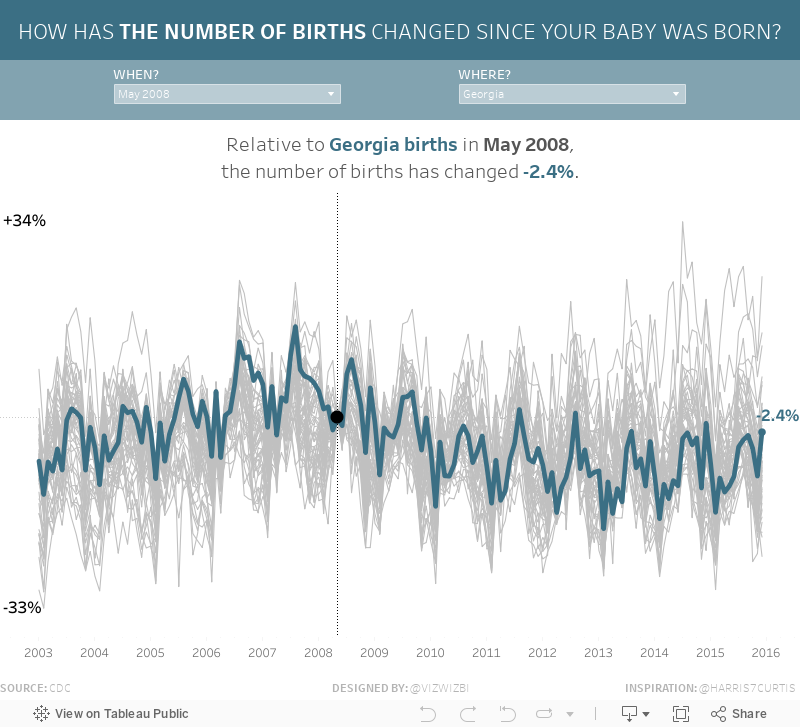
Makeover Monday: How Has the Number of Births Changed Since Your Baby Was Born?
If this data set and viz look familiar, it's because I highlighted it a few weeks ago on DataVizDoneRight and it was also the source for Workout Wednesday Week 31.
What works well?
- Incredible interactivity
- Amazing storytelling as your scroll down the page
- Great use of minimal colors for highlighting
- Great use of context
- Nice example of stepped lines
- Including a link to the source
- Good placement of the filters at the top to encourage the user to use them first
- Including event icons which update the viz based on the year you're viewing
- Great annotations
What could be improved?
- Could use a more impactful title
My Viz
October 22, 2011
Sex, Politics, Disasters and Cheating - What I’ve learned in 800 days of the VizWiz blog
It’s hard to believe that I started this blog on August 13, 2009, 800 days ago (yes, I know my first post wasn’t until Aug 17). The time has absolutely flow by and I’ve learned so much.
For example, I’ve never shaded an axis in lieu of a color legend until today. Heck, I never even thought about until I saw a bunch of vizzes on Tableau Public that were using this style. I’ve always included the color legends, but it’s really not necessary on a dual-axis chart like this with only two colors. You might even call the use of a color legend chart junk in this case.
From what this viz tells me, I should stick to some specific topics if I want to drive traffic:
- Sex
- Politics
- Cheating
- Disasters
Does that surprise you? It doesn’t surprise me since those are topics that generally dominate the news.

One final stat of interest: 90% of the total traffic to my blog has occurred since I posted this viz as part of the Flowing Data contest about STDs. Nathan must be a pretty popular dude.
September 16, 2010
NameVoyager: Baby Name Wizard Graph of Most Popular Baby Names
- Type a name and the graph updates.
- If there is more than one name, it will show all of the choices.
- Type a name and hit enter to show just that name.
- Mouse over the graph and you can see the rank in each decade.
Here's how my family turned out:

It looks like four of the six of us, those with the less popular names, had much more common names at the turn of the 20th century. What can I say? We're an old-fashioned family.






