April 13, 2020
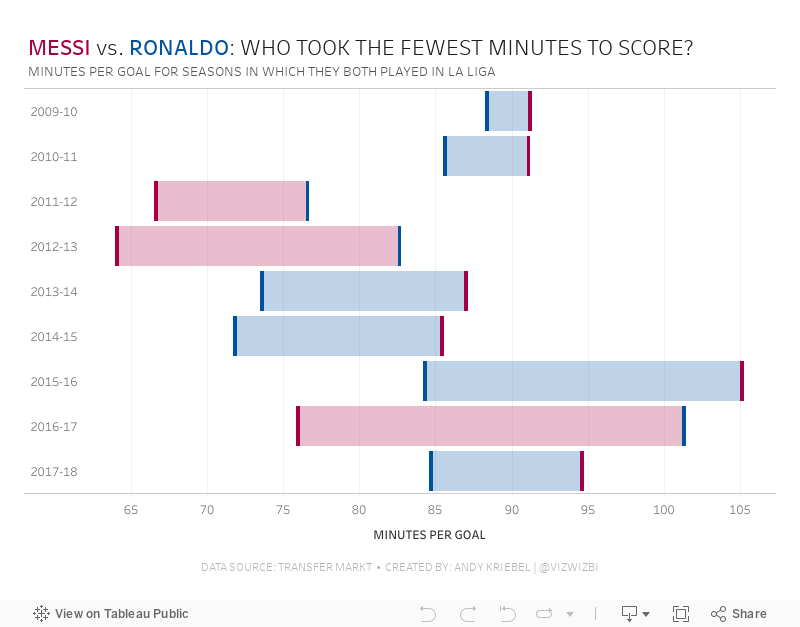
#MakeoverMonday: Messi vs. Ronaldo - Who Took the Fewest Minutes to Score?

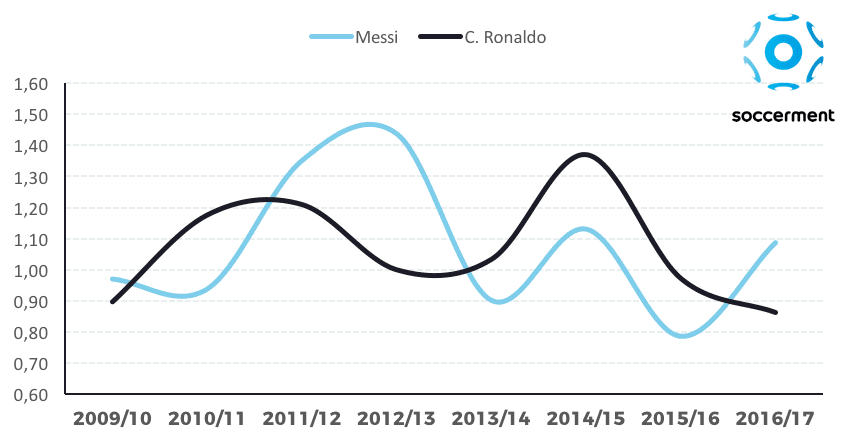
What could be improved?
- Curvy lines don't help you see the exact points of the data. When curved lines are drawn, they render to smooth out the lines, therefore misleading the location of the data along the axis.
- Does the data represent each season or matches within a season? Given that I haven't looked at the data yet, the curved lines make me think the latter.
- Is there a missing title?
- What does the y-axis represent?
- It looks like the data might be goals per match, but that would be misleading since they might have substitute appearances? Would goals per minute normalize the data better?
February 17, 2011
Three stats that matter and one that does not

Triangles, squares & corners: Geometry at its finest and possibly the greatest result ever
No one thought it could be done, but the mighty Barca have fallen! On to the Camp Nou in 20 days.
February 14, 2011
Money League: See how much the top football clubs make
Let me start by saying I am a HUGE Arsenal fan. I catch every game that’s on TV here in the States.
If you’re living under a rock and don’t watch football, the knockout stages of the UEFA Champions League begin Tuesday with Arsenal hosting Barcelona on Wednesday in the biggest tie of the round. Catch the game on Fox Soccer Channel at 2:30pm ET. If you want to see the game played at its absolute highest level, this is the game to watch. It will be a beautiful sight.
Annually Deloitte publishes a list of the top 20 football clubs in the world based on revenue. As always, the Guardian Datablog published a viz to go along with its article. They published this absolutely hideous stacked bar chart. Seriously, this is what they published. How do you even know which team is which? There is a fancy mouse-over feature. This stuff kills me!
With Tableau, there are so many better ways to make this data interesting. Here’s my take:
Interacting with the viz you can quickly see that:
- The Barclays Premier League dwarfs the other leagues in all revenue types
- The Barclays Premier League has seven of the top 20 teams (click on any of the league logos to filter the list of teams)
- Real Madrid is a MUCH bigger club than its city neighbor Atletico de Madrid (350% bigger)
- Manchester United is also a MUCH bigger club than its city neighbor Manchester City (229% bigger). I hate them both, but Manchester City even more since they think they can buy themselves a title. No chance with an Italian manager; the football is way too negative!
- Arsenal dominates matchday revenue, thanks in large part to the spanking new Emirates Stadium (I can’t wait to see it some day). I heard on TV today that they generate $3M every game
- The top three clubs in terms of broadcasting revenue are all in Italy. According to the NY Times, “Italian teams negotiate their own television contracts, with the top clubs like Inter Milan, A.C. Milan and Juventus garnering huge deals”, whereas it’s a shared revenue pool in the other leagues. Heck, Real Madrid’s rank in broadcast revenue puts them at 17th, but their overall revenue has them at #1.
- German clubs lead the way in commercial revenue. I know virtually nothing about the Bundesliga other than their games are fun to watch and the chanting by the fan is endless
Does anything else stand out to you?
Go you Gooners!


