Showing posts with label theft. Show all posts
September 11, 2017
Makeover Monday: Stolen Bikes in the UK
bicycles
,
crime
,
cycling
,
Makeover Monday
,
theft
,
UK
,
united kingdom
2 comments
For this week's makeover, we're looking at the page where you can search a specific postcode. Given I ride to work, I naturally entered our work postcode and got this visualisation.

What works well?
- The search feature and map are very engaging. I wanted to zoom all the way in to work.
- The result set is within a mile of the postcode I entered, providing context and relevancy.
- The map is easy to use. Click on a marker and you get a bit of information about the incident.
- Using a map shows the volume of stolen bikes well.
- The table and tabs provide a simple way for me to lookup information.
What could be improved?
- Clicking on one of the numbers on the map doesn't then drill into each of those incidents.
- The Last 6 Months tab doesn't show trends well.
- The Worst Locations tab isn't very useful if you not very knowledgable about the area.
- All of the tables would be more impactful as charts.
Questions I want to answer
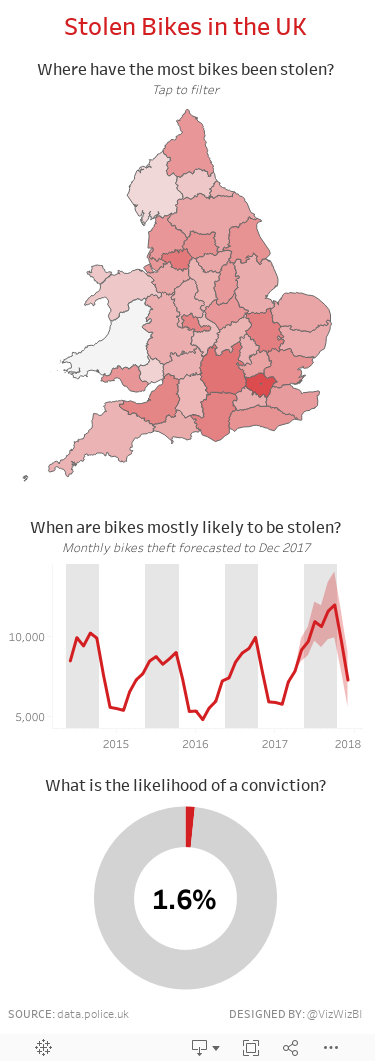
- What are the worst areas in the UK?
- Is bike theft increasing or decreasing overall and in specific areas?
- Are there as few positive outcomes as it seems?
- Where should I avoid locking up my bike?
- Is there any seasonality in the data? My hypothesis is that the number of bikes stolen would reduce in the winter months.
To answer the first question, I downloaded the police force boundaries from data.police.uk and merged all of the KML files together with Alteryx and output the result as a single shapefile.

From there, I blended the shapefiles with the bike theft data to create a map showing the log scale of bike thefts by police force. I chose a log scale because London is a crazy outlier.
With the questions in mind above, here's my Makeover Monday week 37 which I've optimized for mobile consumption.
June 19, 2016
Makeover Monday: Theft in Japan
bar chart
,
icon
,
infographic
,
Japan
,
Makeover Monday
,
theft
5 comments

This past week felt like such a great week for learning and I feel fortunate that I have Makeover Monday to apply those learnings. There are two influences in particular I’d like to call out:
- Rob Radburn gave an amazing presentation about Makeover Monday at TC London. In his presentation he referenced the book “Steal Like an Artist” which I’ve read before. But then Rob went through several examples where he pointed out where he stole like an artist.
- The Data School gave presentations this week that focused on infographics. You can watch their presentations on YouTube here. I was totally blown away by their work and wanted to create one of my own this week.
Before we look at my viz, let’s have a quick look back at the original from Nippon.com.

What works well?
- The data is organized by the theft type, using color to distinguish the groups.
- The total number of thefts is included for context.
- Each outer ring is sorted properly, with “Other” being ranked last.
What doesn’t work well?
- A donut inside a donut is NEVER a good idea.
- Labeling every single slice makes the chart overwhelming and too busy.
- The theft types (inner donut) are in reverse order.
- The colors are ok, but not particularly outstanding.
- Making comparisons is very difficult.
As I mentioned, this week I wanted to create an infographic. Like Rob suggested, I did a quick Google search for inspiration and this identity theft chart from PC Magazine struck me for its colors and organization. Without further ado, here’s my Makeover Monday infographic.
I created this in Tableau 10; if you’d like to download it, you can do so here.
Subscribe to:
Posts
(
Atom
)






