June 26, 2018
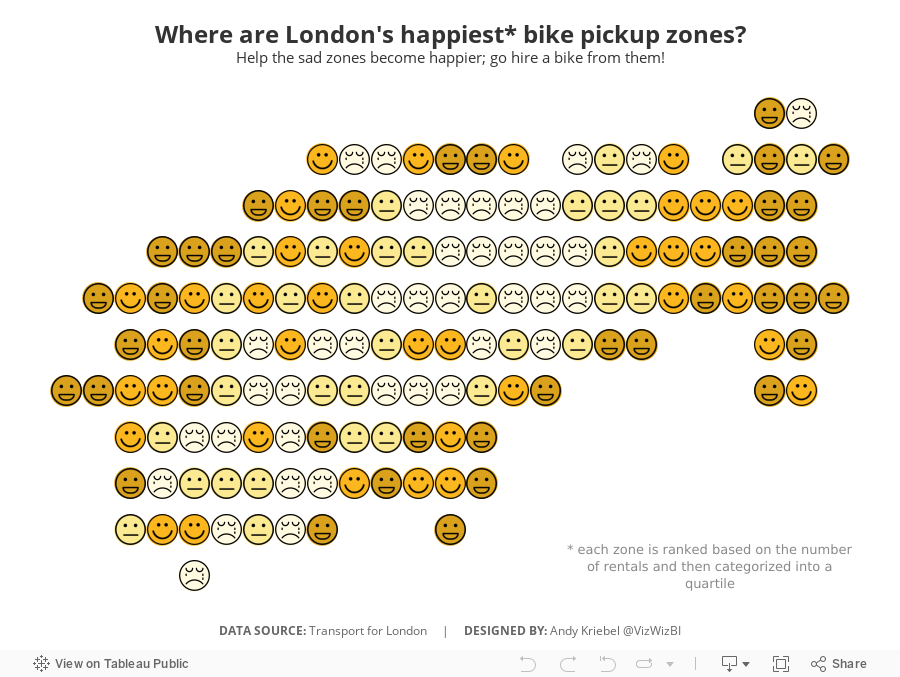
Makeover Monday: Where are London's happiest bike pickup zones?
bicycles
,
cycle hire
,
cycling
,
happiness
,
Makeover Monday
,
santander
,
TfL
,
transport for london
No comments

I created a viz last year about American happiness, so decided to use a similar theme. What I did was group stations together based on their location. It takes two calculations:

You then makes the continuous dimensions and place them on the appropriate shelves (Round Lon on Columns and Round Lat on Rows).
I then created a calculation that ranks each "zone" by the number cycle hires and then places them into percentiles. I then take the percentiles and break them up into happiness quartiles.

I set the Location Happiness to discrete, placed it on the Shapes shelf and applied my emoticon shapes. I then duplicated the Round Lat field on the Rows shelf and moved the Location Happiness field to color, changed the shape to circle, moved the marks to the back and assigned colors.
Simple! I like how this turned out.
Subscribe to:
Post Comments
(
Atom
)


No comments
Post a Comment