February 22, 2017
Tableau Tip Tuesday: How to Add Min/Max Indicators to Sparklines
Ann Jackson
,
dots
,
indicator
,
max
,
min
,
sparklines
,
Tableau Tip Tuesday
4 comments
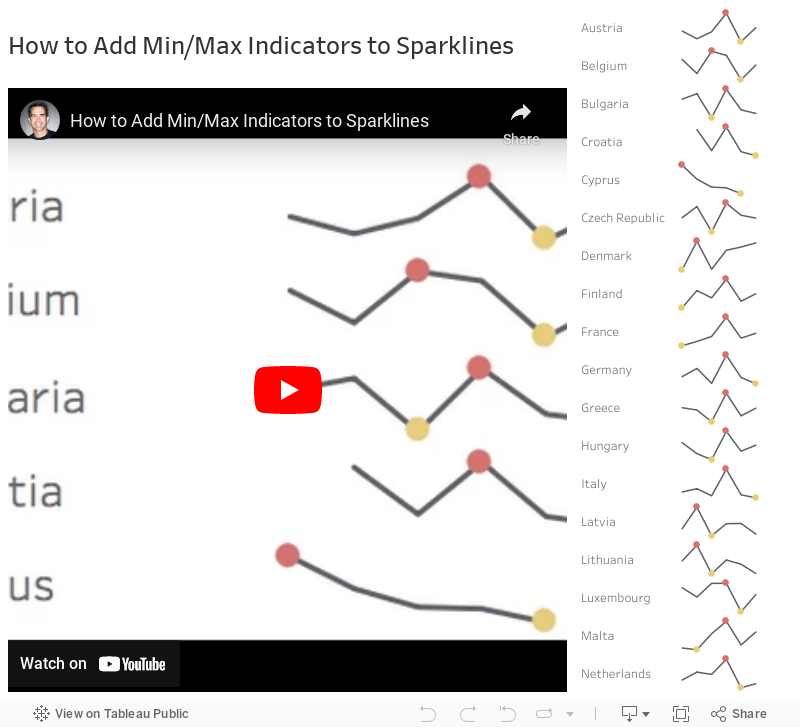
First, let's have a quick look at Ann's viz:

Notice the sparklines with the indicators on the right. In this week's tip, I'll walk you through how I would go about creating those. The video is under five minutes and easily replicable. Enjoy!
Subscribe to:
Post Comments
(
Atom
)


What do you suggest if there are multiple occurrences at the high or low value. I do a lot of metrics where 0 is a valid min value per month. What I can't seem to solve is just showing the first or last min/max value.
ReplyDeleteOff the top of my head, you could do it via a table calculation, but I'd have to spend some time looking at it.
DeleteHi Andy, I tried replicating this with Superstore Sample data for Sales per region. I am not able to calculate Max and Min Sales correctly for each region.Some problem at the level of aggregation:
ReplyDeleteMax Sales =IF ([Sales])={FIXED [Region]:max([Sales])}
then ([Sales]) END
But when i drag this on the axis and synchronize axis, the dots are not aligning with the maximum sales points. What am i doing wrong here?
I have month(Order Date) on columns and Region, Sum(Sales) and Sum(Max sales) on columns
Priyanka, your calculation is overly complicated. If all you want is the max sales per region then the calc should be {FIXED [Region]:max([Sales])}. There's no need for the IF statement.
Delete