March 22, 2017
Workout Wednesday: Highlight a Treemap
calculated field
,
color
,
gradient
,
highlight
,
parameter
,
treemap
,
Workout Wednesday
5 comments
Emma was at it again this week with her little tricks! This week's workout was to rebuild this treemap. You can see all of the requirements on Emma's blog.The requirements are pretty straight forward:
- The treemap should be segmented by Product Category and Product Sub-Category with Sales as the size of each part.
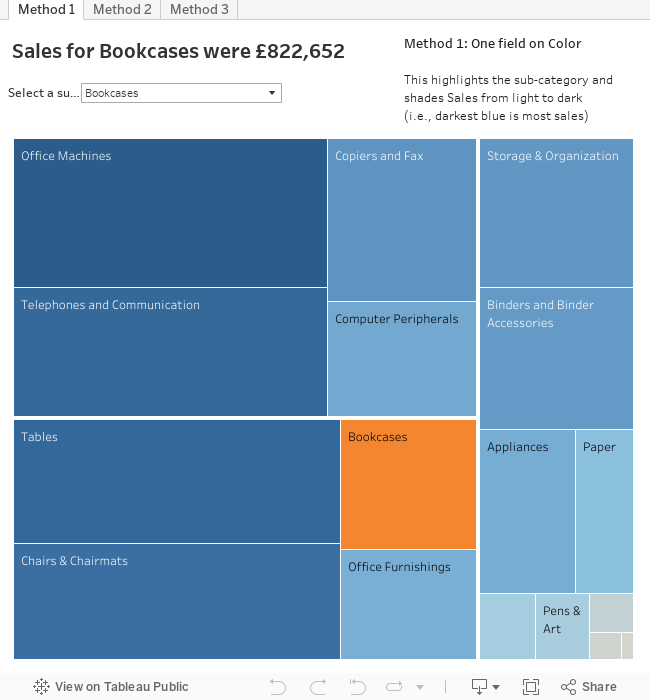
- The Sales value should also colour each segment of the treemap as a gradient (she used blue with the highest sale being the lightest blue).
- You should be able to highlight a segment of the treemap with a different colour (in orange). The part highlighted should be able to be changed by the end user.
I must admit that don't know how to build treemaps in Tableau, so I took the easy way out and used Show Me for I think the first time in quite a while. That was easy!
I had an idea straight away for how to create the necessary calculation for coloring the sub-categories. This, however, resulted in my colors being shaded from lightest to darkest, that is, the sub-category with the largest sales was darkest. Emma's has the darkest color as the least sales, so I knew I wasn't done. This is what you see in the method 1 tab below. Method 1 uses a single calculation, but it won't work if any sub-category has negative sales. Though the treemap would crap out too.
Method 2 matches Emma's exactly. This requires two calculations and understanding when you need to make a field an attribute and when you need to make a field discrete. This method colors the sales from darkest to lightest, with the sub-category with the largest sales being the lightest color.
Method 3 is similar to method 2 in that it requires two fields on the color shelf. However, this colors sales from lightest to darkest, with the sub-category with the largest sales being the darkest color.
Good challenge Mrs. Emma!
Subscribe to:
Post Comments
(
Atom
)


I quite like Method One, but it also has the issue that the Sub-Category highlighted in orange isn't in a uniform hue across the Sub-Categories, as that too is affected by SUM(Sales). That's picky though! Nice way to tackle it with just one "thing" on colour.
ReplyDeleteThanks Charlie! The subcategory would be uniform in color if I enabled the use full color range option.
DeleteIs there a way to do method three and pick what color is used for the gradient on the non-selected categories and a different color for the one selected? (Or do you just have to deal with the default blue and orange) I tried various things and nothing seemed to work.
ReplyDeleteThanks Andy for sharing. Not sure, if we can share our attempts and request your review/comment. If thats' fine, can you comment on this: https://public.tableau.com/views/Treemap_39/Dashboard1?:embed=y&:display_count=yes&:toolbar=no
ReplyDeleteThanks, Sri.
Thanks Andy for the dashboard. But, I am unable to view the dashboard. I am getting the error message as "The load was not able to complete successfully". Could you kindly let me know is there anything wrong from my end.
ReplyDelete