December 15, 2017
Visualizing IT Help Desk Performance
dashboard
,
example
,
help desk
,
IT
,
KPI
,
performance
,
sample
14 comments
I'm looking for some good examples of Customer Support dashboards (incidents, hours worked, forecasting, etc.).
I did a quick Google search and a search on Tableau Public and didn't find anything that was particularly good or useful (even from the support desk software vendors themselves). So I decided the best way to help was to create an example.
I didn't have any data, but I found this dataset on IBM's Watson Analytics website as a sample. The data set contains 100,000 records yet didn't include a date for when tickets were opened. It included a field for how many days a ticket was open though. What to do?
- Create a new column to generate a random date (to the second) between Jan 1 2014 and Dec 31 2016,
- Added a column for the Closed Date based on the difference between the Open Date and the days the ticket was open.
- Randomly removed the Closed Date for some of the records so that I would have some tickets that were not closed (because that's reality).
BOOM! Sample data set done! You can download it here.
From there, I went back to my Google image search to get an idea for the metrics that were important. Many of the designs has a "card" style layout, so I create a design very similar to the P&L statement I created before.
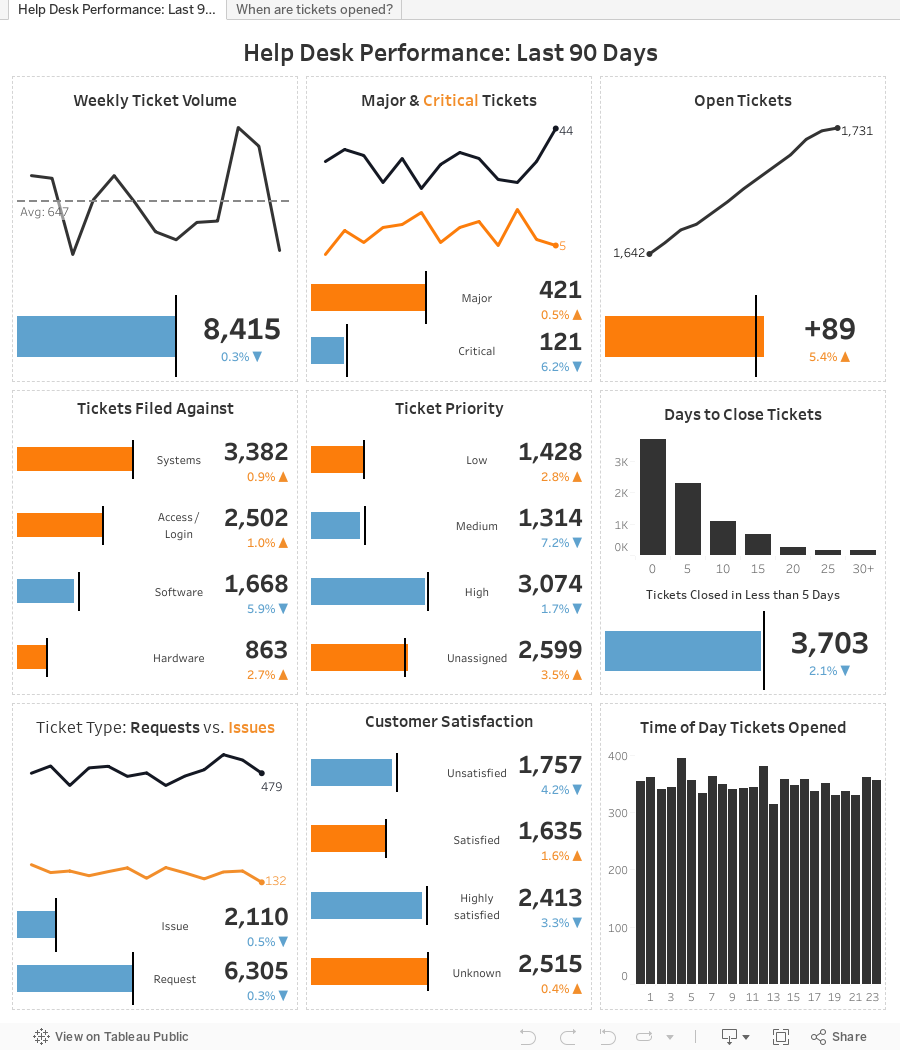
I posted iterations throughout the day and into the evening and got feedback from Eva and Mark Kernke (of Groupon) as he had a similar need. Based on their feedback, here's where I ended up. This is merely a framework, but shows what a IT help desk performance dashboard COULD look like.
I hope you like it! Oh, bonus, there's a mobile version too. Check it out on your phone.
Subscribe to:
Post Comments
(
Atom
)


These are excellent metrics. Almost a carbon copy of what I submit manually running sql queries in Maximo Smart Control Desk database. This will make any I.T. manager smile. The only extra I submit that I'm sure can be pulled are, Ticket numbers by Business Unit, Ticket Ownership by Technician, Customer Satisfaction by Business Unit and a couple others. But this I must say is impressive. Not to mention being delivered automatically via email to respective decision makers or notification emails for given threshold values. Such as customer satisfaction reaches 10%.
ReplyDeleteThanks for the feedback. It’d be easy enough to add or replace these metrics with what is most important for your business. Good luck!
DeleteHi Andy..Unable to download the worksheet. The download option is getting covered by the right pane (popular posts). Can we have a horizontal scroll bar at the bottom of the viz, so that it becomes easier for us to scroll right side. Thanks.
ReplyDeleteMust be your browser resolution. Zoom out or go to my Tableau Public profile and download it from there.
DeleteThanks for creating this viz! I can reverse engineer this for a project I'll be doing. Great work!
ReplyDeleteHey Andy, great Viz! I'm wondering why you couldn't find anything ready made out there. This is obviously something thousands of companies need and there has to be an incentive (ie. I'm not sure I know anyone who LIKES the help desk). So I'm curious why you think this gap exists. What did you find was lacking in the existing visuals?
ReplyDeleteI didn’t find a single example for any vendor that was even close to decent. The designs were all terrible. But I don’t blame them; they provide help desk software not visual analytics. That’s an afterthought for them.
DeleteHi Andy,
ReplyDeleteAwesome as always! I'm trying to use a lot of your methods here as I am currently redesigning our support desk dashboard (great timing!).
I am struggling with the KPI shapes, I've created the same calculated fields as yourself however the KPI triangles aren't displaying for me.
Also, I am tracking COUNTS as opposed to SUMS of support tickets. Why are SUMS used in your example if each support ticket has its own unique ticket ID, would you not want to count each ticket as "1" as opposed to a SUM or running total?
Hi Dan. I’m using sum of the number of records since each ticket has one line. It’d be the same as using countd(Ticket ID). I renamed the Number of Records field to Tickets so I didn’t have to change Axis labels everywhere.
DeleteMy KPI triangles are ascii characters pasted into the custom number format. Check that. Good luck and thanks for the feedback!
This is awesome! Thanks for creating this viz. I was able to reverse engineer and create my own version of it. And Yes I agree even I didn't find a single decent example of help desk dashboard on google to learn from.
ReplyDeleteHey Andy,
ReplyDeleteGreat Viz! I am in CRM and I could use something similar for the service requests that we do for our customers.
I can't download the updated dataset with the provided link. It throws me an error saying file is over 5mb limit and cannot be downloaded using excel online. Any pointer to download the file in other means please? Thanks!
Download the workbook and unzip the TWBX. The data source will be in there.
DeleteI like this dashboard, nice work. I was inspired by your use of the triangle deltas in the formatting.
ReplyDeleteOne critique I might add is not to mix colors for the same dimension within a viz. In your Major & Critical Tickets window, the line graph has Critical as orange, but just below is a bar graph where Critical is blue and Major is orange.
Good shout. I should fix that.
Delete