Showing posts with label trees. Show all posts
December 24, 2017
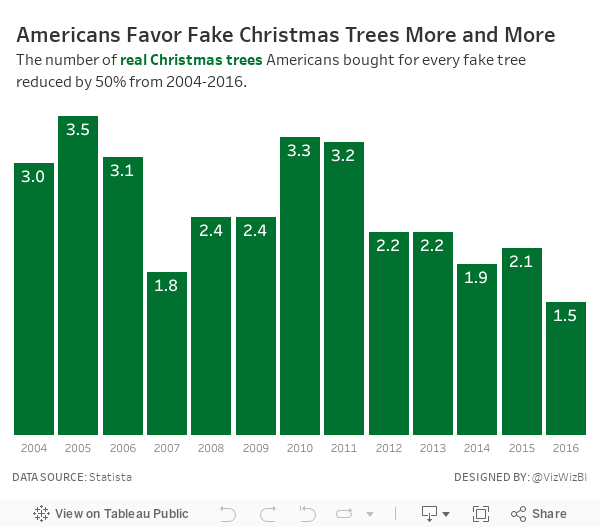
Makeover Monday: Americans Favor Fake Christmas Trees More and More
Here's my challenge for everyone that participates...Get one new person to participate. That's it! Simple! Do it! Everyone will benefit.
For week 52, Eva chose a simple viz from Statista about real vs. fake Christmas tree purchases by Americans. We switched to fake about eight or nine years ago and haven't regretted it one bit. Every year we think about that one tree we have saved.

What works well?
- Nice interactivity on the tooltips
- Colors are easy to distinguish
- The tops of the stacked bars allow you to see the overall trend of all tree purchases
What could be improved?
- Including all of the labels on the bar is distracting
- Remove the shadows from the text
- Use colors that are associated better with trees (like green)
- Use a more impactful title and the wrapping is sloppy
- Use a smaller footer that won't take up way so much space
My Goals
- Complete something quick; it's Christmas Eve after all
- Find something interesting in the data
- Use Christmasy colors
- Use a title that tells the user what they're seeing
With those goals in mind, here is my last Makeover Monday for 2017. See you next year!
October 25, 2017
Overcoming Burnout, Hexbin Maps and New York City's Urban Forest
hex map
,
hexbin
,
Matt Chambers
,
nature
,
new york city
,
trees
3 comments
How do I overcome burnout?
For me, the best way to overcome burnout isn't to stop; that would mean not doing what I love to do. What works for me is to switch to something in my backlog, to work on a project I've been putting off, to learn something new or maybe to practice a technique. This helps re-energize me.
I can't recommend this strategy to everyone; burnout is tough. Sometimes the right decision IS to stop everything, to decompress, to get away from it all. I've done that before and it works as well. More often than not, though, I get sad when I'm not using Tableau. It's a product that has fundamentally changed my life. I'm an addict.
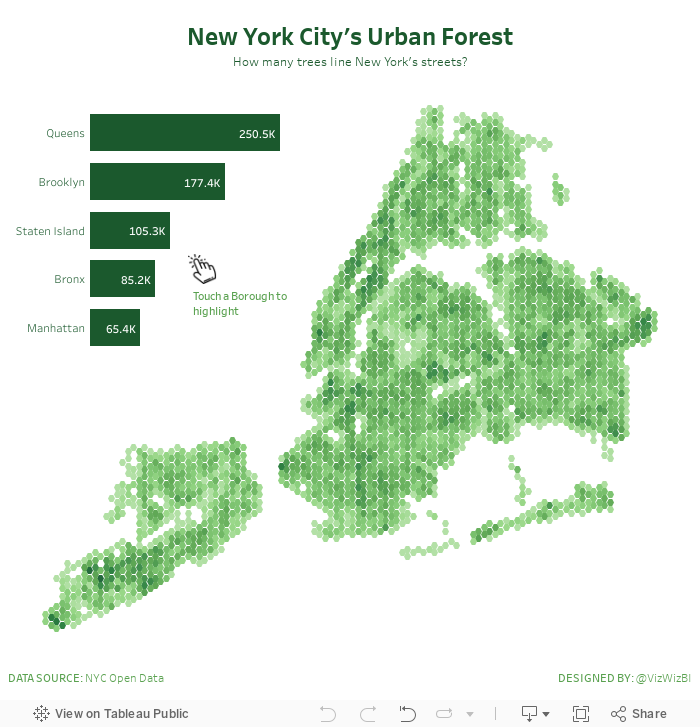
New York City's Urban Forest
Last night while I was preparing for Workout Wednesday, I had an idea to practice hexbin maps. Why that popped into my head I have no idea, but I went with it. I looked for a dataset that would work well as hexbins. I searched my emails and found this visualisation about trees in New York City. Fortunately NYC makes the location of every tree available here.
Why does this dataset work well with hexbin maps? According to Mapbox:
Binning is a great alternative technique for visualizing density when working with large data sets.
So, burnout temporarily overcome and I got to practice a technique I hadn't used in a while. That's a win win for me! Enjoy!
Subscribe to:
Posts
(
Atom
)






