December 22, 2019
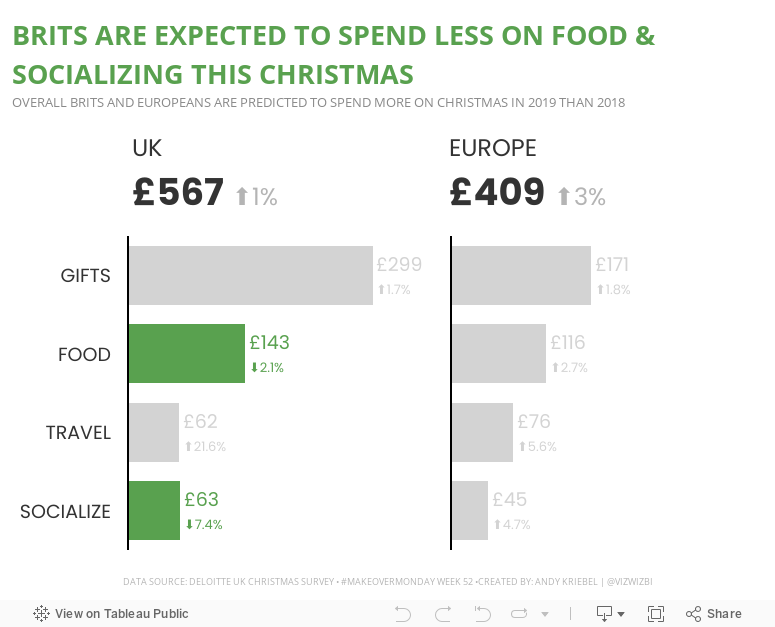
#MakeoverMonday: How much are Brits & Europeans expected to spend on Christmas?

This week, Eva picked Christmas-themed data...a simple survey from Deloitte about expected Christmas spending and the UK and Europe.

What works well?
- It a simple table that is easy to understand without doing much thinking.
- My eyes were immediately drawn to the two red declining arrows, which makes it seem to be the focus on the visualization.
- The table is neatly organized from highest to lowest spending categories.
- Everything is clearly labeled.
- The highlight box on the right provides a nice summary.
What could be improved?
- Remove the shading from 2018
- Removed the shading from the background of the Total cell
- Align the text labels either left of right, but not center
- Remove the borders between the rows, but keep them to separate the headers and totals from the rest of the table
- Change the font color of the categories to black; green could give the impression that they are increasing
- Align the arrows on the second table with the rows they correspond to
- Why is spending less red? I would think spending less is good

December 23, 2018
Makeover Monday: Spending on Christmas Gifts in America

I believe Charlie Hutcheson is the only community member to complete all 156 weeks, though Simona Loffredo has only a couple of weeks to catch up on before the end of the year to join Charlie (and me) in the 100% club. As of this writing, Charlie has 307 vizzes on his Tableau Public profile, while Simona has 197. That's an incredible achievement and a testament to their dedication to improve week by week.
It's nearly Christmas Day, so Eva picked a Christmas-themed data set. Let's have a look at the viz:
 |
| Original viz by Statista |
What works well?
- It's a line chart based on time, so it's easy to understand what it's telling us.
- Using one color
- I kind of like the banding for every other year.
- Good axis title for the measure
What could be improved?
- Remove all of the numbers except the first and last years.
- Add a title
- Add the data source; surely Statista didn't come up with the data themselves.
- Remove the paywall so we can see information about the source and the publisher.
- Remove the paywall for downloading the data. All you really need to do is type the numbers into Excel anyway.
- Is there any insight?
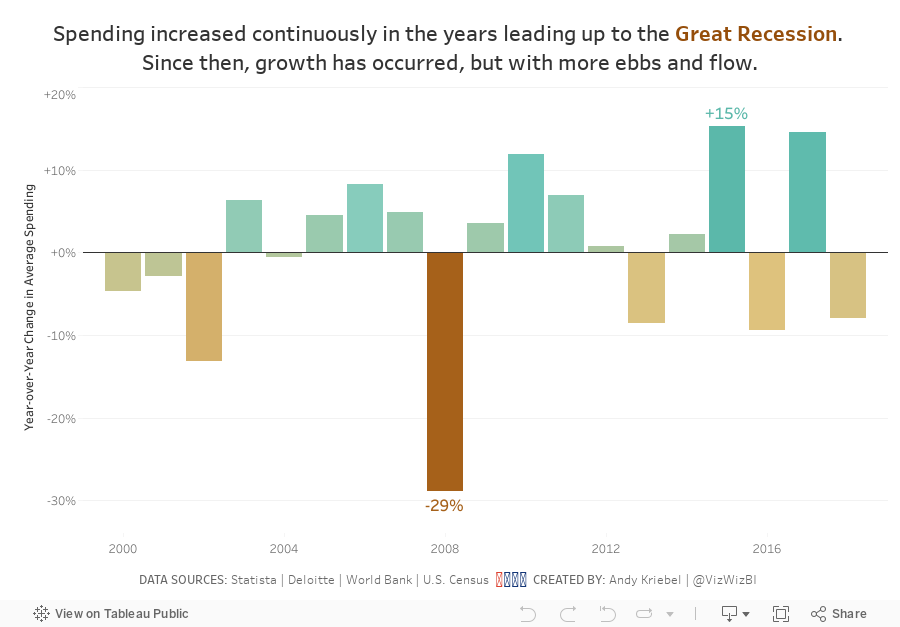
What I did
- Create something simple
- Supplement with additional data to see if it can add any context.
- Deloitte's 2018 Holiday Survey of Consumers for information about the number of gifts purchased
- US Census for Monthly Retail Trade spending - I used the Total (excl. Motor Vehicle and Gas) and divided it by the number of months.
- Population data from the World Bank (1999-2017) and the US Census (2018)
- Looked at year-over-year change
- Compare the statistics to look for relationships
December 27, 2017
Workout Wednesday: UK's Favorite Christmas Chocolates
This week, Emma set out a challenge for us to viz the UK's favorite Christmas chocolates in a single sheet.
- Remake the dashboard in one sheet / view.
- Copy the colours - the favourite chocolate should be orange, the least favourite dark grey, and the rest light grey. You CANNOT use manual colours based on the chocolate name - it has to be based on the ranking of the chocolates in each brand.
- Label the bars with the chocolate name and the percent of people who picked it as their favourite.
- Match all the titles, tooltips and labelling exactly
December 24, 2017
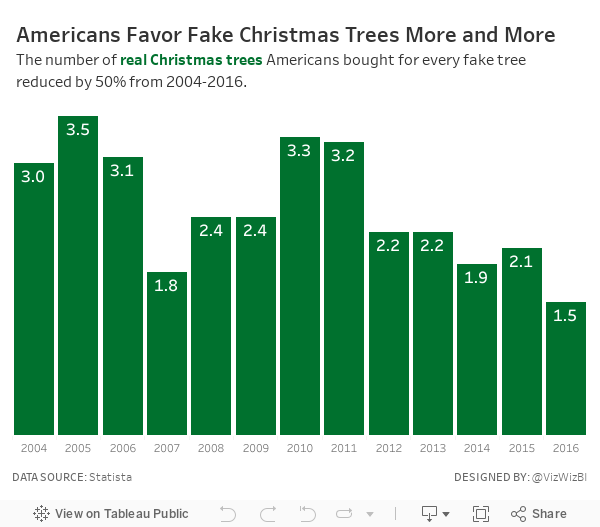
Makeover Monday: Americans Favor Fake Christmas Trees More and More
Here's my challenge for everyone that participates...Get one new person to participate. That's it! Simple! Do it! Everyone will benefit.
For week 52, Eva chose a simple viz from Statista about real vs. fake Christmas tree purchases by Americans. We switched to fake about eight or nine years ago and haven't regretted it one bit. Every year we think about that one tree we have saved.

What works well?
- Nice interactivity on the tooltips
- Colors are easy to distinguish
- The tops of the stacked bars allow you to see the overall trend of all tree purchases
What could be improved?
- Including all of the labels on the bar is distracting
- Remove the shadows from the text
- Use colors that are associated better with trees (like green)
- Use a more impactful title and the wrapping is sloppy
- Use a smaller footer that won't take up way so much space
My Goals
- Complete something quick; it's Christmas Eve after all
- Find something interesting in the data
- Use Christmasy colors
- Use a title that tells the user what they're seeing
December 26, 2016
Makeover Monday: How Much Has the Cost of Christmas Dinner Really Risen?

Well, this is it! 52 weeks of Makeover Monday under our belts. Thank you for an incredible year and for participating in this amazing project.
In case you missed it, Makeover Monday will continue in 2017. Eva Murray and I have big plans in store for everyone. If you ever have questions, comments or feedback, give us a tweet.
Ok, so onto week 52. The BBC published an article early in December about the cost of Christmas dinner in the UK with this blaring headline:
Christmas dinner costs 'rise 14%'
Inside the article were these basic charts:


Fortunately, Andy C was able to locate the data on BBC Github. Let’s review the charts.
What works well?
- A line chart is a good choice for showing change over time.
- The line chart uses about a 3x2 ratio which doesn’t distort the shape too much given the axis is zoomed in.
- The bar charts work fine for comparing the two years.
What doesn’t work well?
- The line chart has smoothed curves, which lead you to believe there were changes throughout the year, but the data is only at the yearly level. This could be misleading.
- What food are included? The data on Github doesn’t match the data in the chart? How are we to know what they consider to be the Christmas foods?
- There’s no logical sort to the bar chart. It’s neither sorted by 2015 nor 2016. I can’t make out how it’s sorted.
- The bar chart doesn’t include all foods they have data for, so why did they only show these foods? Are these the foods that comprise the line chart? We have no way of knowing.
- Were the Christmas themed colors in the bar chart intentional? If so, I get why they did it, but it won’t work for their colour-blind readers.
- The title of the bar chart indicates it’s about the price change, but they make the reader do the change maths in their head. Why not just show the change?
- Why are they comparing 2016 to 2015 and not a different year? That seems a bit shortsighted and sensationalist to me.
For my version, I thought it was important to:
- Indicate when the peak price occurred
- Show the entire time period to get a better sense for the rate of change
- Indicate whether the 2016 price has increased or decreased compared to 2006
- Sort the products by the 2016 price
- Show the rate of change and the latest price
- Optimise the view for mobile
Given these ideas above, here is my last Makeover Monday for 2016. I’m looking forward to continuing this project with Eva in 2017.






