Showing posts with label visitors. Show all posts
November 3, 2019
#MakeoverMonday: Is Las Vegas Convention Attendance a Recession Indicator?
convention
,
economics
,
economy
,
indicator
,
Las Vegas
,
Makeover Monday
,
recession
,
visitors
No comments

 |
| SOURCE: Calculated Risk |
What works well?
- The time goes from oldest to latest.
- The colors are easy to distinguish.
- The axes are well labeled.
- Including the caveat for 2019 since it's not a complete year in the data.
What could be improved?
- The axes aren't synchronized; I'd like to see how they would look synchronized.
- Without referring back to the color legend, I don't know which axis goes with which metric.
- Using a dual axis chart implies there's a correlation between the two measures. There might be, but it could be displayed other way to make that more evident.
- There no indicator of the data source.
What I did
I started by reading the original blog post. What caught my attention in particular was the last sentence:
Historically, declines in Las Vegas visitor traffic have been associated with economic weakness, so the slight declines over the last two years was concerning.
Super interesting! So this is where my worked started. I first annualized the data to make 2019 comparable to the rest of the years. From there, I created a connected scatterplot, which takes the two metrics in the original chart, plots one on the x-axis and the other on the y-axis, and connect the points by the year. This lead to a swirly look at the end, which made the relationship difficult to understand.
Instead, I chose to focus on the "red" line of the original, i.e., convention visitors. I wanted to see if convention visitors was indeed a recession indicator. The chart was simple to make, then some googling turned up the recession dates. Low and behold, convention visitors to Vegas sure do look like a leading indicator for a recession. If this is true, then we're on the verge of a recession very soon.
Click on the image for the interactive version.
December 19, 2014
VizWiz: 1 million pageviews and counting
blogger
,
blogging
,
followers
,
pageviews
,
posts
,
sessions
,
stats
,
traffic
,
users
,
visitors
2 comments
Dear Readers,
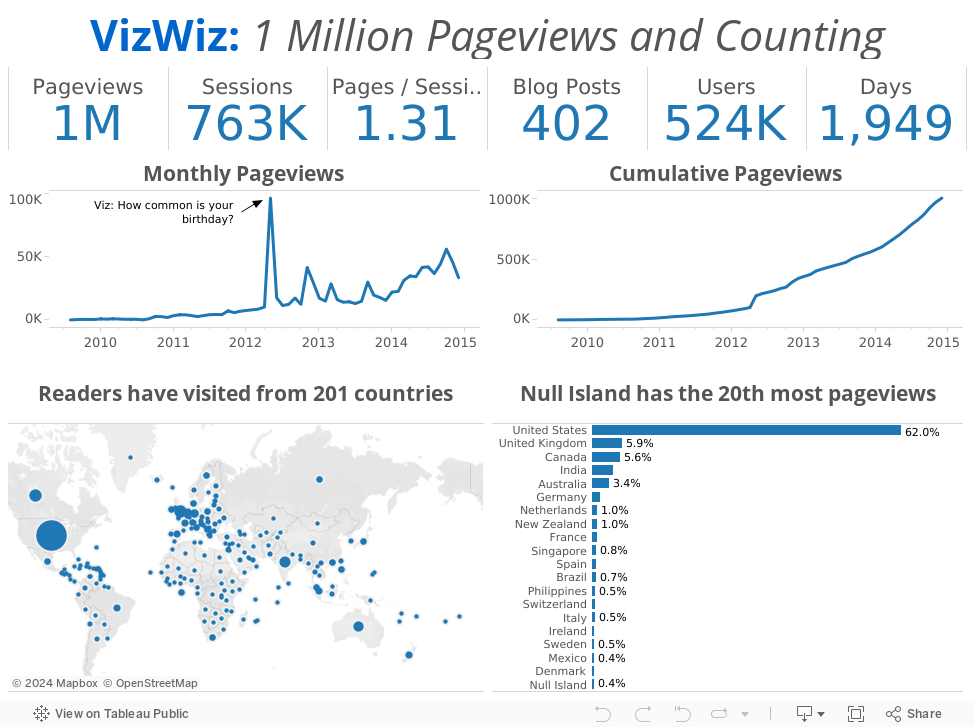
I started this blog as a way to document what I had been learning, starting with a simple makeover of a pie chart. 1,949 days and 402 posts later, at 8:48pm PT on December 18, 2014, my blog officially reached 1 million pageviews. I can't believe it!!
It's been an incredible journey. Thank you all so much for reading what I write. I love to write and I love to share, so blogging has proven to be a perfect platform for me.
Thank you for your comments! Thank you for your emails! Thank you for your phone calls! Thank you for your advice! Thank you Tableau for making the most addictive piece of software I've ever used!
What better way to celebrate than with a simple viz of my basic blogger stats. Here's to another million!
All the best,
Andy
I started this blog as a way to document what I had been learning, starting with a simple makeover of a pie chart. 1,949 days and 402 posts later, at 8:48pm PT on December 18, 2014, my blog officially reached 1 million pageviews. I can't believe it!!
 |
| Image From http://www.cinevox.be/ |
Thank you for your comments! Thank you for your emails! Thank you for your phone calls! Thank you for your advice! Thank you Tableau for making the most addictive piece of software I've ever used!
What better way to celebrate than with a simple viz of my basic blogger stats. Here's to another million!
All the best,
Andy
May 4, 2011
Who’s visiting the VizWiz?
I started this blog 624 days ago on August 17, 2009 with the goal of helping others (and me) learn best practices for data visualization. There have been many twists and turns and the backlog of blog posts has gotten quite long. The breadth of the audience of this blog worldwide has both fascinated and humbled me. 145 blog posts later, here are the stats, visualized of course.
The bubbles are sized based on the rank of the country for the stat & time frame chosen. The color is based on the stat chosen.
Thanks for the visits and comments. I learn a lot from your feedback.
Subscribe to:
Posts
(
Atom
)






