May 14, 2018
Makeover Monday: Which European commuters spend the most time in traffic jams?


What works well?
- Bars are ranked in descending order
- Simple, clear title
- Axis title tells us what the bars represent
- Nice tooltips
- Footnotes that qualify the data
What could be improved?
- The alternating bar colors add no meaning.
- The title has a weird shape to it.
My Goals
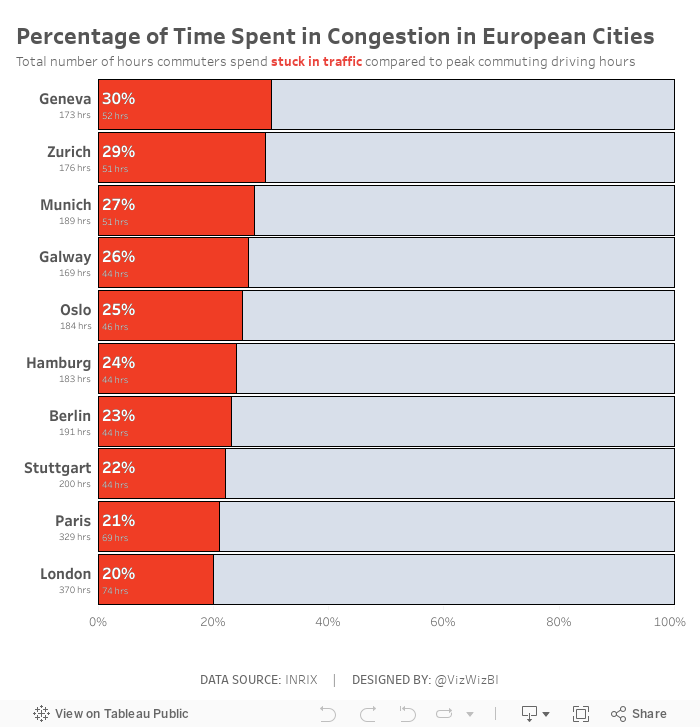
- Change the metric to percent of time spend in congestion during peak hours, which required me to go to the source to get the additional data.
- I took inspiration from Eva's viz, but wanted to show the congestion as a percentage rather than a raw number. I feel this gives move context to the numbers and lets the audience know their likelihood of being stuck in traffic in these cities.
- Create the viz as a single worksheet.
December 19, 2014
VizWiz: 1 million pageviews and counting
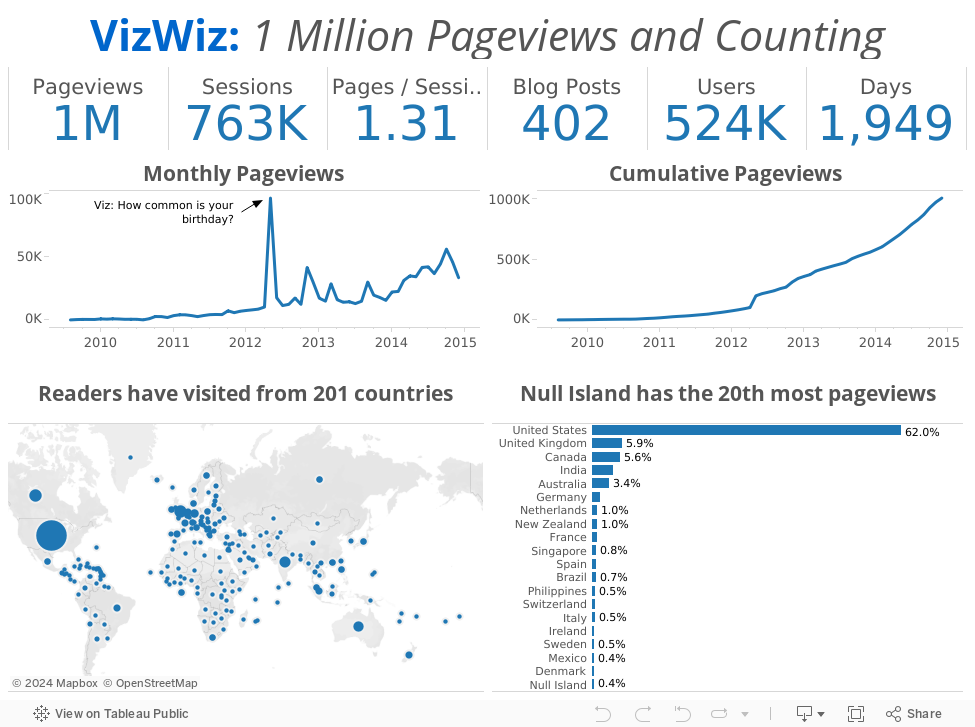
I started this blog as a way to document what I had been learning, starting with a simple makeover of a pie chart. 1,949 days and 402 posts later, at 8:48pm PT on December 18, 2014, my blog officially reached 1 million pageviews. I can't believe it!!
 |
| Image From http://www.cinevox.be/ |
Thank you for your comments! Thank you for your emails! Thank you for your phone calls! Thank you for your advice! Thank you Tableau for making the most addictive piece of software I've ever used!
What better way to celebrate than with a simple viz of my basic blogger stats. Here's to another million!
All the best,
Andy
March 19, 2013
VizWiz has reached a milestone. Thanks for following!
Today this little blog, that’s basically my data viz diary, passed 400,000 pageviews. I appreciate all of the visits, comments and thoughtful conversation. I learn something new every day!

August 19, 2011
Chartbeat – A cute but deficient web traffic dashboard
While reading an article on Sports Chart of the Day, a cute little gauge on the right sidebar titled “The Engage-O-Meter” caught my eye. Naturally I clicked on it (which must mean they did something correct with its placement). The gauge directs you to a chartbeat.com dashboard that’s capturing real-time site traffic for businessinsider.com.
The amount of information on the page is impressive, overwhelming and disorganized. Two pieces of the dashboard confused my straight away (and they’re the only two sections of the dashboard you see when the screen first appears because there’s so much spaced used at the top for basically nothing).
Let’s dissect these two charts/graphs.

What mistakes have been made?
- It takes up way too much space on the dashboard. There’s a ton of white space in this one chart alone.
- The active visits number could be represented as just that, a number. The gauge isn’t necessary and doesn’t add any value.
- The new & returning users are difficult to interpret. Why do the numbers need to be so precise? Would a relative measure, like % of total, be more appropriate?
I would present this information in a table. Ultimately we’re simply “looking up” the data, which lends well to a table. We’re not attempting to determine any trends, which is what charts do well.
| Active Visits | |
| Now | 8,342 |
| 30-day Min | 3 |
| 30-day Max | 17,971 |
|
| |
| Visitor Composition | |
| New | 20% |
| Returning | 80% |
Onto the second chart.

What could be improved? What’s confusing?
- This “Top Pages” section, is merely a list of the top pages and their respective number of active visits. Why not a simple list?
- Do the circles add any value? To me they don’t. Each circle represents 10 active users, but the layout of the circles doesn’t make sense. If you count across, there are 19 columns. Why not 20? That’d at least make it easier to estimate the totals.
- If you multiply the number of circles by 10 in each section, you don’t get the same total as represented by the number itself.
- I believe, but can’t substantiate, that they’re making this similar to a Merimekko chart, which is a chart that encodes two variables: one for height and one for width. I don’t see why this would be necessary at all.
Maybe representing all of the data as a bar chart would be better.

In the end, with these two simple changes, I’ve been able to save a ton of space. The rest of their dashboard could be reworked as well and maybe it’d all fit into one nice window.
May 24, 2011
The World’s Deadliest Roads – Watch out for cars in Africa
Before you travel around the world, you may want to consider where you are safest. According to the Guardian, road traffic accidents “kill more people around the world than malaria”. While China would obviously have the highest number of accidents based on the size of the population, I was surprised that many countries in Africa and the Middle East have such a high incidence of deaths (measured as deaths per 100K of population).
Use the interactive viz below to see if anything stands out to you. One good way to look at the data to really make the death rate in Africa stand out is to choose “Estimated Deaths per 100K” for both the color and the size. What do you see?






