March 17, 2015
Tableau Tip Tuesday: Two Techniques for Nested Sorting
combined fields
,
nested
,
rank
,
sort
,
tableau
,
tip
,
Tuesday
25 comments
Early on in my 2-day Tableau courses, I teach about sorting in Tableau. You would think that teaching about sorting would be a pretty boring topic, but it’s easy to get the students engaged when you talked about nested sorting. Another way to think about nested sorting is to consider it sorting by more than one dimension.
In this week’s tip, I review two techniques for accomplishing nested sorting:
Download the workbook used to create this video here.
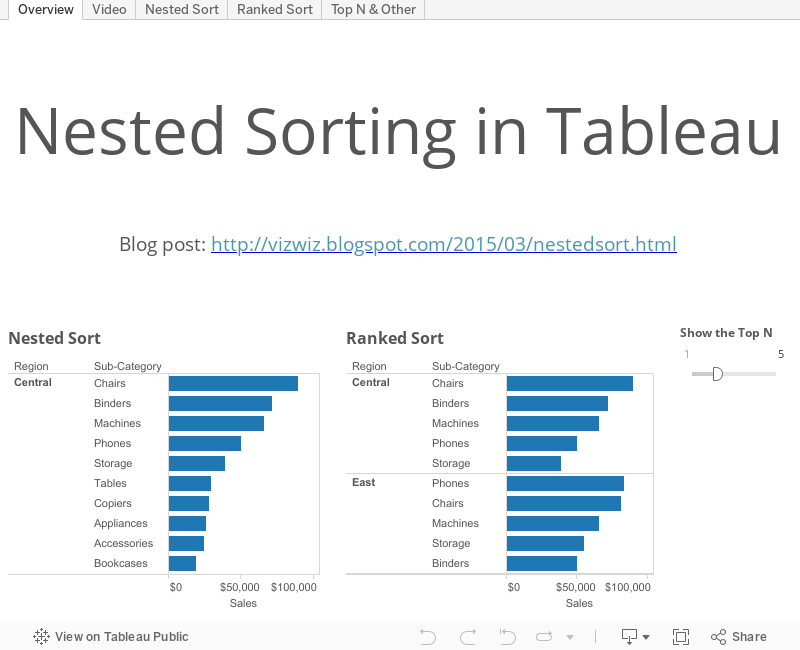
In this week’s tip, I review two techniques for accomplishing nested sorting:
- Using combined fields
- Using the rank function, which has the additional benefit of allowing top N filtering
Download the workbook used to create this video here.
Subscribe to:
Post Comments
(
Atom
)


Hi Andy. Very helpful, as always. You may want to check your size, as this viz does not fit in the blogger window; it's usable but you have to scroll left and right.
ReplyDeleteThanks Jon, I'll check it. It's the same size as every other week. Are those too big as well?
ReplyDeleteIt also could be the size of your screen. It fits in my screen. The blog has responsive design based on your browser whereas Tableau does not.
I'm seeing the same thing. This is the first time I've encountered it.
ReplyDeletePeter/Jon, it should be fixed now. The problem was that I published worksheets and not dashboards, so Tableau made them really wide for some reason. I've moved them to fixed size dashboards now. Thanks for letting me know.
DeleteHi Andy, thank you for the Viz. It was really helpful. But if the requirement was to compare sales for all Regions/Sub-Categories together, you can create a calculated field with index() and drag it on the Rows shelf as the first column (Discrete). Sort the Sales in Descending Order and Hide the index value. But this doesn't help in the TOP N values filter. Let me know if this was helpful and if you can help me use this method to get the TOP N values. Thanks !
ReplyDeleteAjay, before the RANK function existed, the only way to do this ranked sorting was via the INDEX function as you've done.
DeleteAndy, how can I use this method for filtering the TOP N values? Would a combination of Parameter and Calculated Fields be the only way?
DeleteAjay, the technique I outlined using the rank function will work.
DeleteThanks Andy.
DeleteNice video! I just wrote a post on the same topic using Rank_Unique(). My only concern of using Rank() is that it may produce non-distinct rankings. This may not be a concern for sales figures which are hardly duplicates.
ReplyDeletehttp://vizdiff.blogspot.com/2015/03/nested-sorting-and-top-n-per-category.html
BTW, your workbook needs Tableau 9 to open.
ReplyDeleteYes, we (mere mortals still on 8.3) can't open it.
DeleteAndy, as always your site comes up when looking for tips on "do X in Tableau" I came across another "dual" sort situation. I want to sort by "Sales" first, and then by "Cost" second. So in the event that two groups tie (say if they have zero sales) then I want to sort the second bars by cost.
ReplyDeleteI had to do it in SQL because I couldn't sort on a Table calculation, but I made a calculated field called "dualsort" = sales_rank*100 + cost_rank and then sorted on that and it worked perfectly.
I suppose we could call this "pivot sorting"? Two column sorting?
Great use of a calc ther Kris! Nice work!
DeleteBrilliant and very helpful, thankyou
ReplyDeleteWhenever I add a color mark to my rank sorted graphic it messes up my sorting... Are you familiar with this?
ReplyDeleteYes, that's because you changed the level of detail to be more granular. You likely need to include this in the Addressing section of the advanced table calc window.
DeleteHi Andy,
ReplyDeleteThanks for this tutorial! Although it was pretty useful for one my projects, I get stucked once I want to include a third Dimension in the rows. I tried to replicate the process depicted in both of your examples but it seems that Tableau is not sorting the way I want (i.e. first per region, then per subcategory, and finally per another new subcategory). I was wondering if you could help me out with this issue. Thank you!
Fede
Create a calculated field that concatenates the three fields together. Then sort on that field.
DeleteThis is definitely helpful. I am trying to do the same thing, but also add an "other" category where everything after the top N values gets put. Is there a way to do this?
ReplyDeleteRyan, I've added a tab to the viz above named Top N & Other. If you download the workbook, you'll see how I made it work with table calcs. I suspect there's an easier way with LOD calcs, but I didn't spend time trying to figure that out. I knew I could get it to work with table calcs.
DeleteHi Andy!
ReplyDeleteI've a question wish you can help me out. I've successfully ranked the bar chart and got top 10 in one worksheet. How can I apply this Top 10 filter in another worksheet directly? I'm going to create a map and only show the top 10 data in the map.
Hi Eva. If you're using a RANK, which is a table calculation, you can't make it work across worksheets as table calcs only work on the current view. You could write a FIXED LOD instead to apply across the worksheets.
DeleteHey Andy,
ReplyDeleteIs it possible to hide/remove the rank column on the graph?
It is hidden.
Delete