March 12, 2015
How Has the Cost of a Beer Changed in the NBA?
bar chart
,
basketball
,
beer
,
Carl Allchin
,
change
,
interactive
,
NBA
,
prices
,
slope graph
,
tableau
No comments
If any of you have had the pleasure of meeting Carl Allchin, you likely knew within about five minutes that he's a huge fan of the NBA, particularly the San Antonio Spurs. Earlier this week, I had some adult beverages with Carl and he told me he was headed to New York to see his beloved Spurs play the lowly Knicks.
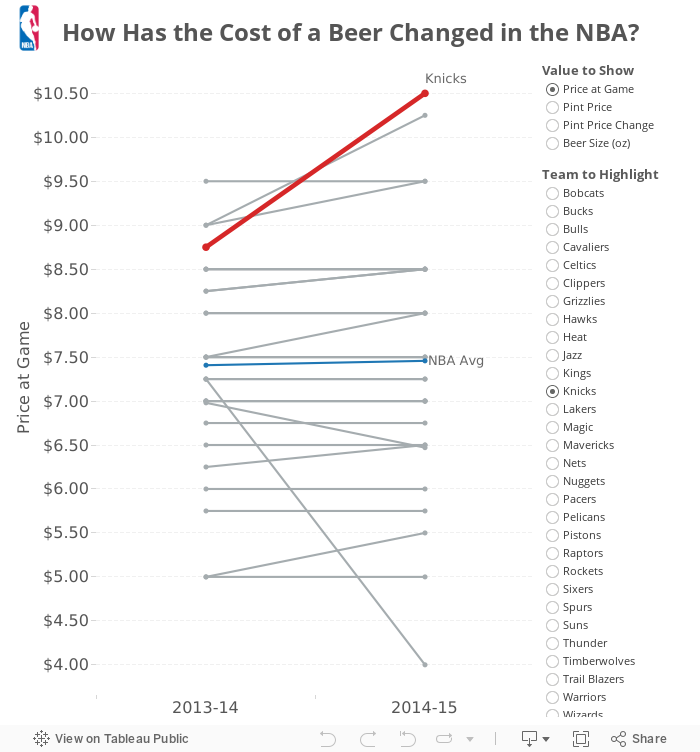
And that got me thinking. What will a beer cost Carl at Madison Square Garden? How does that compare to the rest of the league?
I found the data on Business Insider (here and here) and manually entered it into an Excel spreadsheet, which you can download here. The data only includes the cost that you actually pay in the stadium, but different teams serve different size beers. What I've done is created a selector for you to pick the value you are interested in:
This was fun, and didn't take too long. That's the beauty of Tableau: You think of an interesting question, find some data, and create something interesting quickly. Cheers!
You can download the workbook used to create this viz here (requires Tableau 9).
And that got me thinking. What will a beer cost Carl at Madison Square Garden? How does that compare to the rest of the league?
I found the data on Business Insider (here and here) and manually entered it into an Excel spreadsheet, which you can download here. The data only includes the cost that you actually pay in the stadium, but different teams serve different size beers. What I've done is created a selector for you to pick the value you are interested in:
- Price at Game - This is the price that you actually pay in the arena. Note that the Knicks, where Carl will be going, have the most expensive beer in the NBA.
- Pint Price - I took the actual price, divided it by the size and multiplied that by 16 to get the pint price. This normalizes the prices across the league. The Knicks are the second highest price by this metric.
- Pint Price Change - I created this metric because I was interested to see how the price has changed from last season. The Hawks doubled the pint price, while the Knicks have actually reduced the price by 10%.
- Beer Size - I thought it would be interesting to see if the team keep the size of the beer the same each year. They don't.
This was fun, and didn't take too long. That's the beauty of Tableau: You think of an interesting question, find some data, and create something interesting quickly. Cheers!
You can download the workbook used to create this viz here (requires Tableau 9).
Subscribe to:
Post Comments
(
Atom
)


No comments
Post a Comment