November 28, 2016
Makeover Monday: Wealth Inequality in the United States


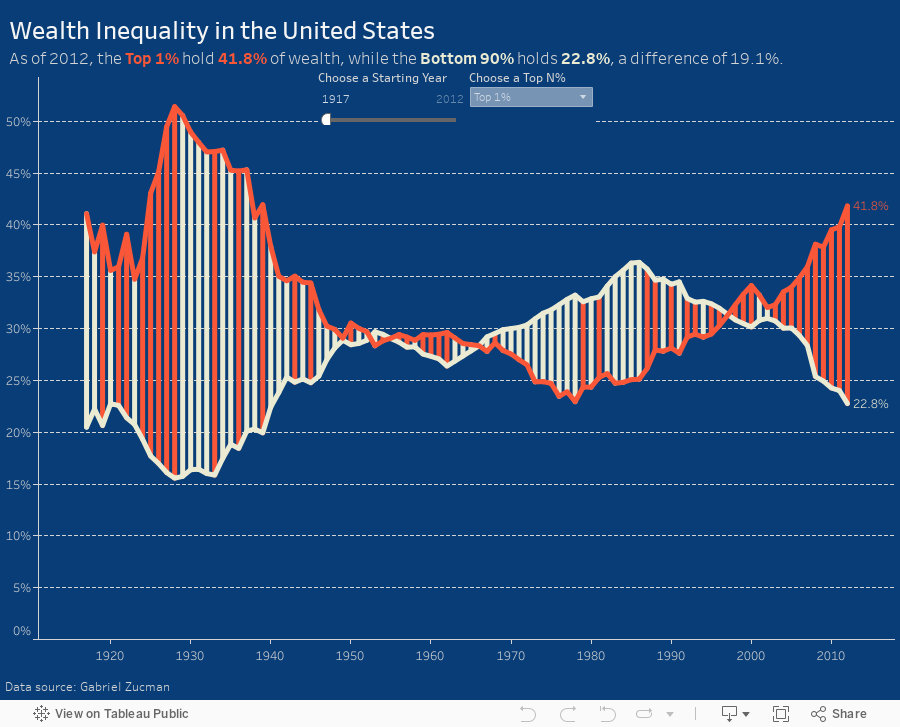
What works well?
- Line chart is an appropriate chart choice as we're comparing two values over time
- Title is clear and simple
- Good sourcing and footnotes
- Tells a simple story effectively
What could be improved?
- Only one axis is needed
- Title is a bit misleading as the values aren't actually equivalent
- Color choices imply democrat vs. republican
- Feels like there's a bit of extra visual clutter
- Difference could be accentuated more
This week, I again recorded all of my work along the way. In 45 minutes, I created 175 images. But this doesn't include parameters, filters and all the work done inside the dashboard, otherwise it would probably be twice as many.

You'll see in my final version that I put a lot of focus on the difference between the lines. I also used a parameter so the user can pick their own comparison. I also have a dynamic subtitle that updates based on the values picked in the parameter.
Subscribe to:
Post Comments
(
Atom
)


No comments
Post a Comment