March 28, 2017
Tableau Tip Tuesday: How to Use One Parameter With Unlimited Number Formats
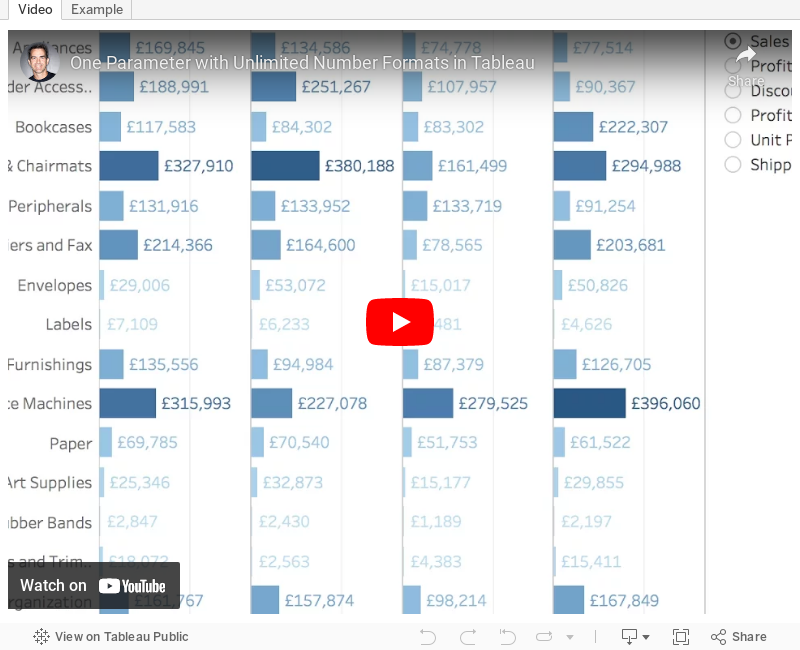
In this week's video, I show you how to use a single parameter with unlimited number formats. This is particularly useful when you have a single chart with a single measure and you want you user to be able to swap out the measure, yet retain the number formatting for the measure (e.g., currency vs. percentages).
Subscribe to:
Post Comments
(
Atom
)


Good morning Andy,
ReplyDeleteas always a very helpful video.
Is there any way to attach the choosen parameter name to the axis?
Thank's for your help.
Cheers
Holger
Yes, just drag the parameter to the columns shelf and place it where you'd like it to appear.
DeleteThank you. This exactly addresses something I was currently struggling with. Great post.
ReplyDeleteFYI... I found creating the various calculated field needed using formulas in Excel saves a lot of time.
DeleteHelp me understand why you need 6 calculations? Why can't you just format the original measures (Sales, Profit, Unit price, etc) and use these in the same way? I'm sure I'm missing something but can't figure out what.
ReplyDeleteI need 6 calcs because if I use the origjnal measures, they will display irrespective of what's selected in the parameter.
DeleteThis comment has been removed by a blog administrator.
ReplyDeleteThanks Andy
ReplyDeleteVery helpful video, one thing i want to ask is that can we change color of chart as we change parameters. For example when we select sales parameter, color of chart should change to blue and when we select profit ratio color of chart should change to green and so on and so forth. Please suggest
Andy - Thanks for this great video. I have a conditional formatting issue that I can't seem to find an answer. I have Public Health data that's separated into Measures for county data and state data. Within that data are several different data types - Dollars, Count, Percent, Rate per 100,000, etc. I want different formatting based on these data types - is there a way to do this in Tableau? I've asked several people and scoured the Tableau Forums and other places but can't find an example.
ReplyDeleteAny suggestion from you or your visitors would be helpful.
Thanks, Joel
Hi Joel. This is the scenario this video solves. Did you download the workbook to see how it was done?
DeleteAndy - I think I understand. If I create calc fields for the different data types for the data like 'County Data Count' and then use them instead of the fields you used in the example. Would I use the calc fields in the parameter? or would I even need one since i already have filters for showing the correct public health measure?
DeleteHere is the viz
https://public.tableau.com/views/OhioSEOWTestVizwStory/Story1?:embed=y&:display_count=yes
Thanks for the inspiration.
Joel
You need a separate calc field for each measure. When that measure is picked from the parameter list, the value returns, otherwise null. Then place all of them on the labels shelf and make sure they are all on the same line. Format them each the way you want (e.g., currency or percentage) then it should display fine.
Delete