May 27, 2018
Makeover Monday: Europe Is Moving Up the Ranks of the World’s Wealthiest Regions

The viz to makeover this week comes from the World Economic Forum.

What works well?
- Good title and subtitle
- The colors scale, from dark to light, make it relatively easy to see which cities are the most and least expensive.
- It's easy to see that the bottom-left cities is the most expensive and the upper-right is the least expensive (of the list).
- Including footnotes for the data
- Including the source
What could be improved?
- A treemap is used to represent parts-to-whole relationships. This is only a selected set of cities.
- Displaying square meters as parts-to-whole makes no sense at all.
- The sorting of the treemap is strange. It seems the whole chart should be flipped on the y-axis.
My Goals
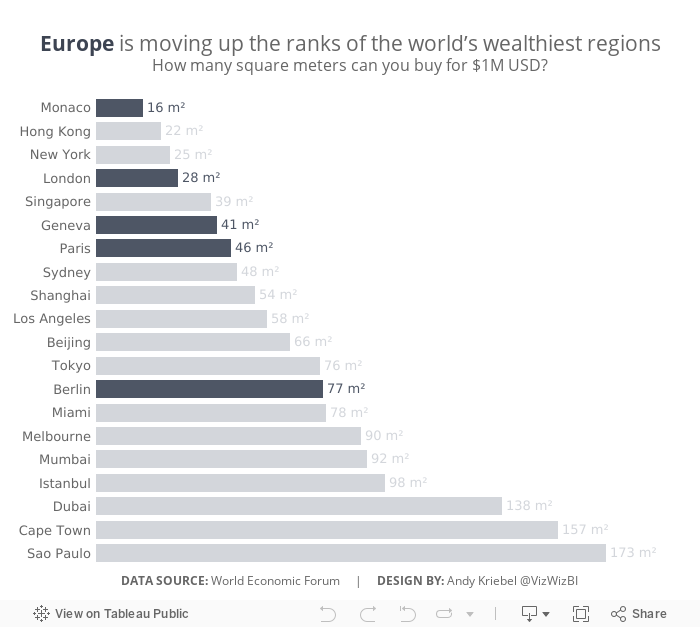
- After reading the article that the source refers to, I wanted to look at cities by their regions and focus on Europe.
- Make the ranking of the cities much easier to understand
- Use highlighting to focus the analysis
- Make everything in a single chart (except the mobile version since I can't change the title and caption font size)
With that, here's my simple bar chart showing how European cities are mostly ranked near the top of the list of the World's wealthiest cities.
May 21, 2018
Makeover Monday: How well did The Guardian predict the Premier League table?
English Premier League
,
EPL
,
football
,
Guardian
,
Makeover Monday
,
soccer
,
sports
,
unit chart
3 comments


What works well?
- Sorting the teams by prediction makes sense since this is an evaluation of their performance against their prediction.
- Including the logos so people can find their favorite team
- Including the numbers for the table position so that the reader doesn't have to count as they go
- Shading every other row helps break up the view
What could be improved?
- If you don't know the team logos, it can be hard to track a team across the table.
- It's hard to see which team did better and worse than expected.
- There's no scale for how "well" The Guardian predicted the table.
My Goals
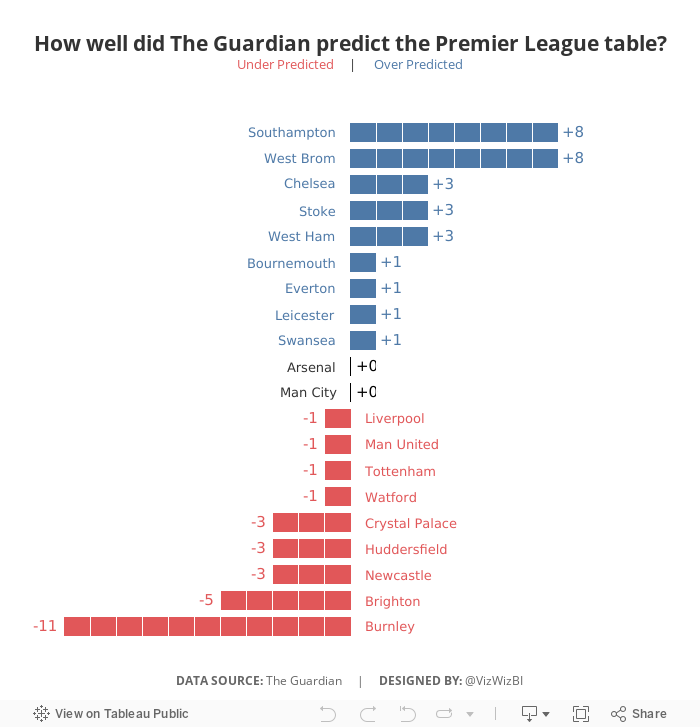
- Focus on the difference between the predicted and actual results
- Try to create some sort of unit chart (I didn't have time to figure out the calcs, so I cheated with distribution bands)
- Make it easier to see if team finished above or below the predictions
- Finish in under an hour because we did MM live at the Data School and had to present to Eva at the end of the hour
May 14, 2018
Makeover Monday: Which European commuters spend the most time in traffic jams?


What works well?
- Bars are ranked in descending order
- Simple, clear title
- Axis title tells us what the bars represent
- Nice tooltips
- Footnotes that qualify the data
What could be improved?
- The alternating bar colors add no meaning.
- The title has a weird shape to it.
My Goals
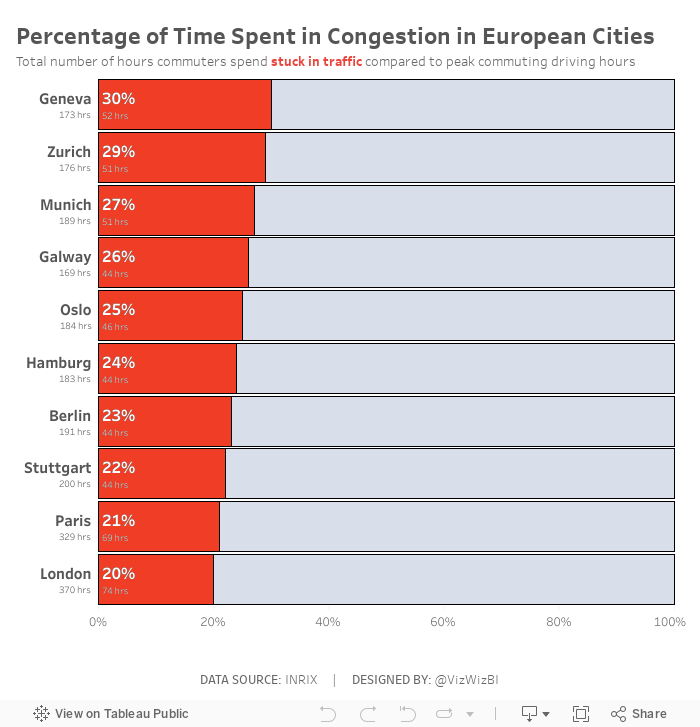
- Change the metric to percent of time spend in congestion during peak hours, which required me to go to the source to get the additional data.
- I took inspiration from Eva's viz, but wanted to show the congestion as a percentage rather than a raw number. I feel this gives move context to the numbers and lets the audience know their likelihood of being stuck in traffic in these cities.
- Create the viz as a single worksheet.
May 6, 2018
Makeover Monday: Toughest Sport by Skill
ESPN
,
Makeover Monday
,
skills
,
sports
1 comment


What works well?
- The sports are ordered by the rank by default, making it easy to see how the compare to other sports.
- You can sort by any of the column headers.
- All of the definitions are provided and thoroughly explained.
- If you need to look up a value, a table works perfectly.
What could be improved?
- It needs to be easier to see the relative difference between sports.
- Comparing more than one metric at a time across two sports takes too much brain power (for me at least).
- Filtering would help make the list more digestible.
My Goals
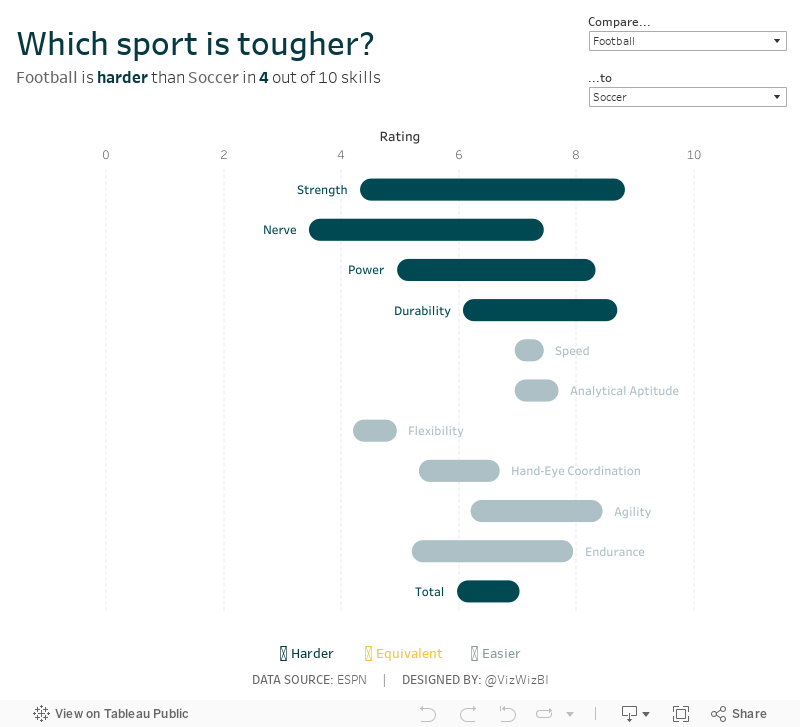
- Allow the user to compare two sports, rather than all sports at once.
- Make the difference between the sports across all of the skills easier to understand.
- Show which skill is harder/easier when comparing two sports.
Subscribe to:
Posts
(
Atom
)


