December 10, 2014
Using data blending to compare a superset of the same data source
calculated field
,
comparison
,
data blending
,
median
,
superset
,
table calculation
,
tableau
,
tips
,
tricks
2 comments
Yesterday at work, I received the following scenario that one of our users was stuck on:
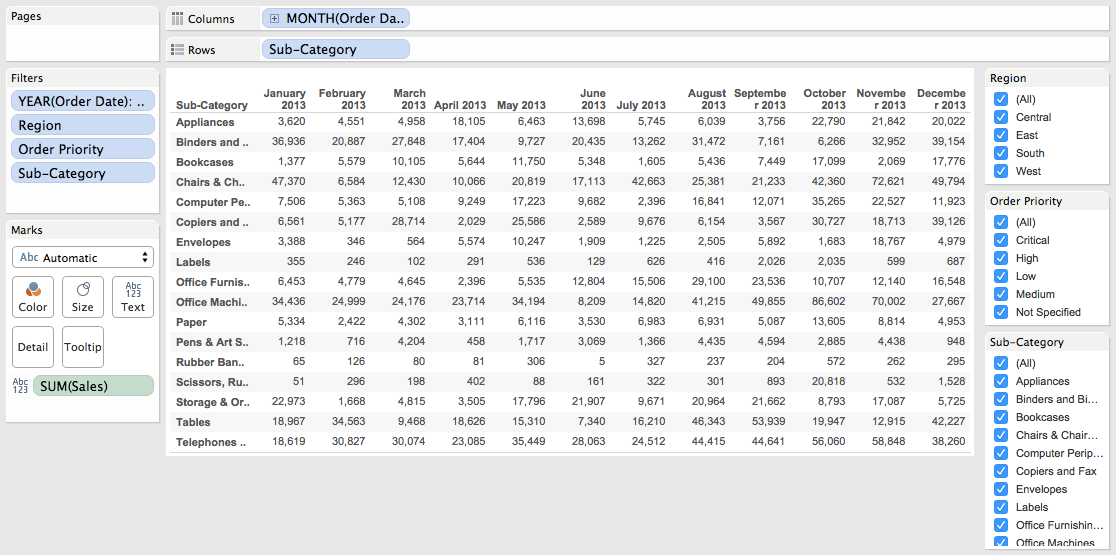
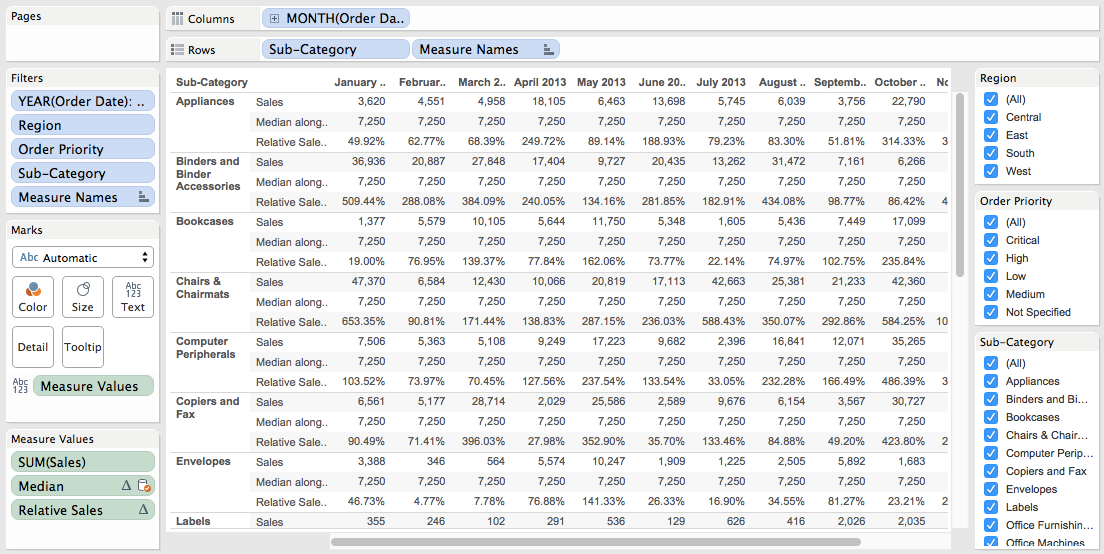
First, consider that you have a view like this, which is sales by monthly by subcategory, with quick filters for region, order priority and subcategory.
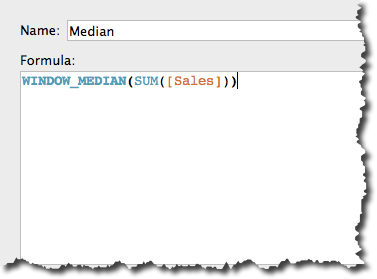
Next, create the median calculation and add it to the view. Remember, the median should account for the entire view.
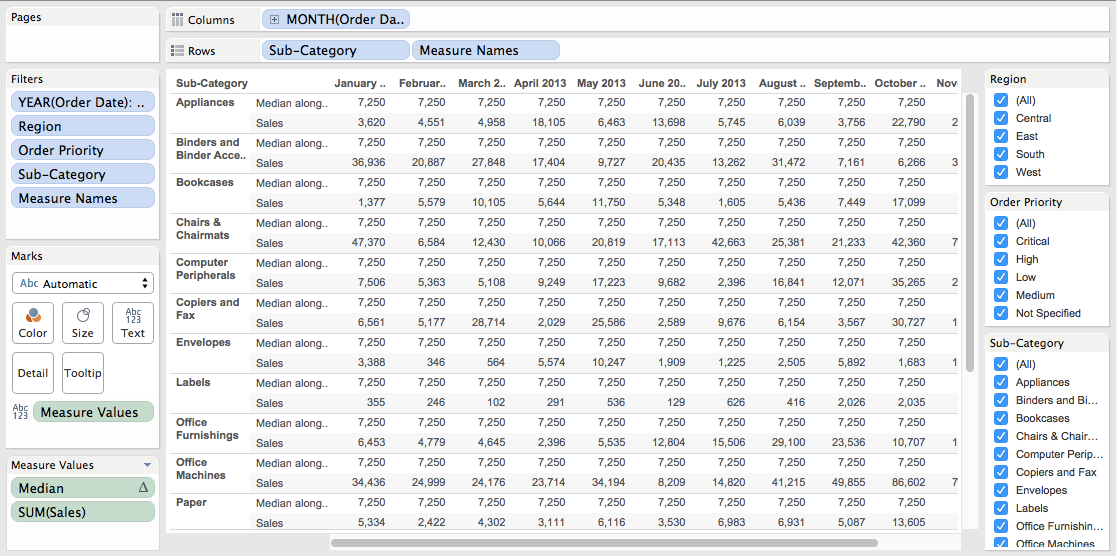
I've added Median to the view and changed the Compute using to Table (Across then down).
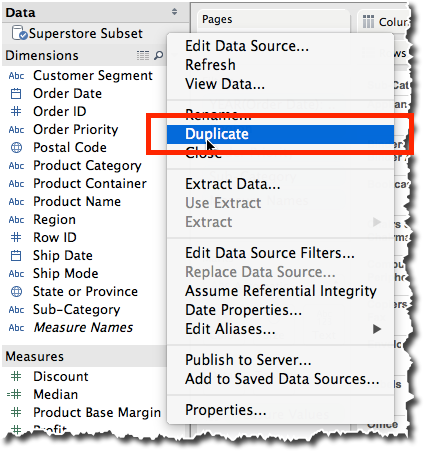
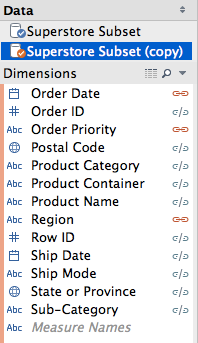
Duplicate the data source by right-clicking on it and choosing Duplicate.
You should now see a copy of the data source in the data window. Go to your secondary data source and drag Median into the view and change the Compute using to Table (Across then down).

Sweet! We're almost done!
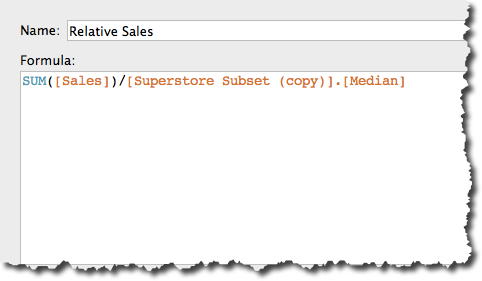
Create a calculated field in your primary data source for the Relative Sales. This is going to use Sales from the primary data source and divide it by the Median Sales from the secondary data source.
Change the default format of this new field to percentage. Choose the right level of precision for your data. Add Relative Sales to the view and again change the Compute using to Table (Across then down).
It might look like we're done now, but we're not. If I filter by Subcategory at this point, my median changes, which I don't want. To make this work, we have to tell Tableau which fields to use in the blend.
In the Dimensions list, we want Tableau to blend on Order Date, Region and Order Priority, but not Subcategory, so click/un-click the link icons as appropriate.
Wait! What just happened? Our median has changed! Why? Is that right? Yes, that is correct, because we removed Subcategory from the blend, therefore when Tableau calculates the median, it's no longer considering Subcategory in the calculation, which is what we want.

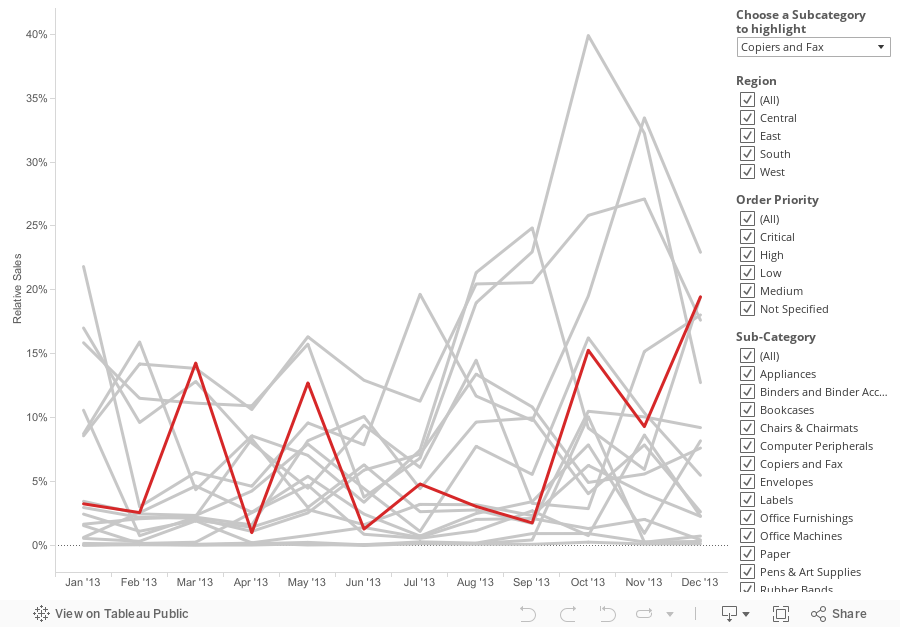
Now I need to make this look a little prettier. I'm going to change it to a line chart and allow the user to pick the Subcategory they want to highlight.
 Download the workbook here.
There is a list of products that the user can filter. The monthly sales for each product needs to be compared to median of all products across all of the months, but the median should recalculate if the user filters the region and/or priority. The end result should be a "Relative Sales" calc that is the sales for each subcategory divided by the median of all sales.The trick here is that the Subcategory filter cannot impact the median calculation. The steps below could also easily be applied to a sum, min or max. I demonstrating a median because that was the question at hand.
First, consider that you have a view like this, which is sales by monthly by subcategory, with quick filters for region, order priority and subcategory.
Next, create the median calculation and add it to the view. Remember, the median should account for the entire view.
Duplicate the data source by right-clicking on it and choosing Duplicate.
Sweet! We're almost done!
Create a calculated field in your primary data source for the Relative Sales. This is going to use Sales from the primary data source and divide it by the Median Sales from the secondary data source.
Change the default format of this new field to percentage. Choose the right level of precision for your data. Add Relative Sales to the view and again change the Compute using to Table (Across then down).
It might look like we're done now, but we're not. If I filter by Subcategory at this point, my median changes, which I don't want. To make this work, we have to tell Tableau which fields to use in the blend.
In the Dimensions list, we want Tableau to blend on Order Date, Region and Order Priority, but not Subcategory, so click/un-click the link icons as appropriate.
Wait! What just happened? Our median has changed! Why? Is that right? Yes, that is correct, because we removed Subcategory from the blend, therefore when Tableau calculates the median, it's no longer considering Subcategory in the calculation, which is what we want.
Now I need to make this look a little prettier. I'm going to change it to a line chart and allow the user to pick the Subcategory they want to highlight.
Subscribe to:
Post Comments
(
Atom
)


This comment has been removed by the author.
ReplyDeleteHi
ReplyDeletewhen i Go to my secondary data source and drag Median into the view it shows four times of the value to me. what am i supposed to do to rectify it.
Thanks in Advance
Praveen