March 21, 2017
Tableau Tip Tuesday: How to Create a Full Year Heatmap Calendar with Month Labels
axis
,
calendar
,
continuous
,
heatmap
,
Kevin Taylor
,
labels
,
months
,
stock
,
Tableau Tip Tuesday
5 comments
This week's video is an extension of the great blog post by Kevin Taylor on the Tableau blog about how to create full year heatmap calendars. This video shows you how to add month labels to the visualisation.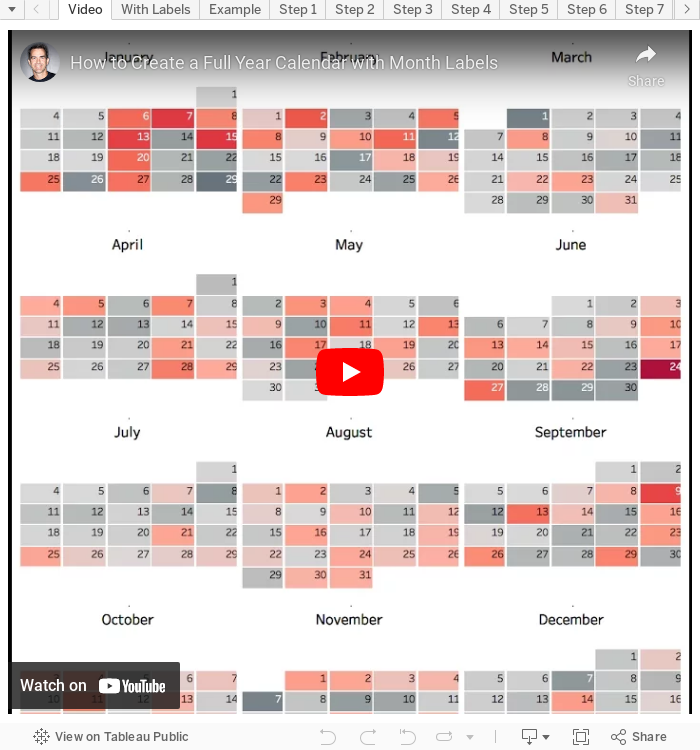
Subscribe to:
Post Comments
(
Atom
)


I noticed the "Shootings" example displays days with no data. Last time I made a run at a calendar like this in Tableau, I was having trouble building the calendar framework so it would display days even when there's no data to display for that day.
ReplyDeleteYou can only display days when there is data to display. If you want to show all days even when there isn't data, then you'll need to blend or join to another data source that has every single date.
Deletenice Andy, thanks for posting
ReplyDeleteHello, sorry to bother you, but the week label, when I change to text it seems work erratically.
ReplyDeleteInstead of showing always -2, sometimes shows -10 or -8. Do you picture What I am doing wrong?
Thank you in advance!
My Bad I was trayibg to do it without watching the video, now I got it!
Delete