Showing posts with label rates. Show all posts
November 12, 2019
#MakeoverMonday: Literacy Rates Around the World
children
,
country
,
dot plot
,
goal
,
line chart
,
literacy
,
Makeover Monday
,
median
,
men
,
rates
,
SDG
,
trend
,
women
No comments

Here's the original viz:

What works well?
- The data by region is ordered alphabetically, making it easy to find each region.
- The bar chart is sorted by largest to smallest.
- Nice filtering options
What could be improved?
- A diverging color palette should only be used when there is a logical midpoint or goal. I don't see those in this viz.
- The squares are hard to understand.
- I don't find the map very useful. It would be more useful if it zoomed in when a region is selected.
- There's no title.
- There's too much text.
- The bar chart seems to go out past the edge, or at least visually it appears that way.
What I did
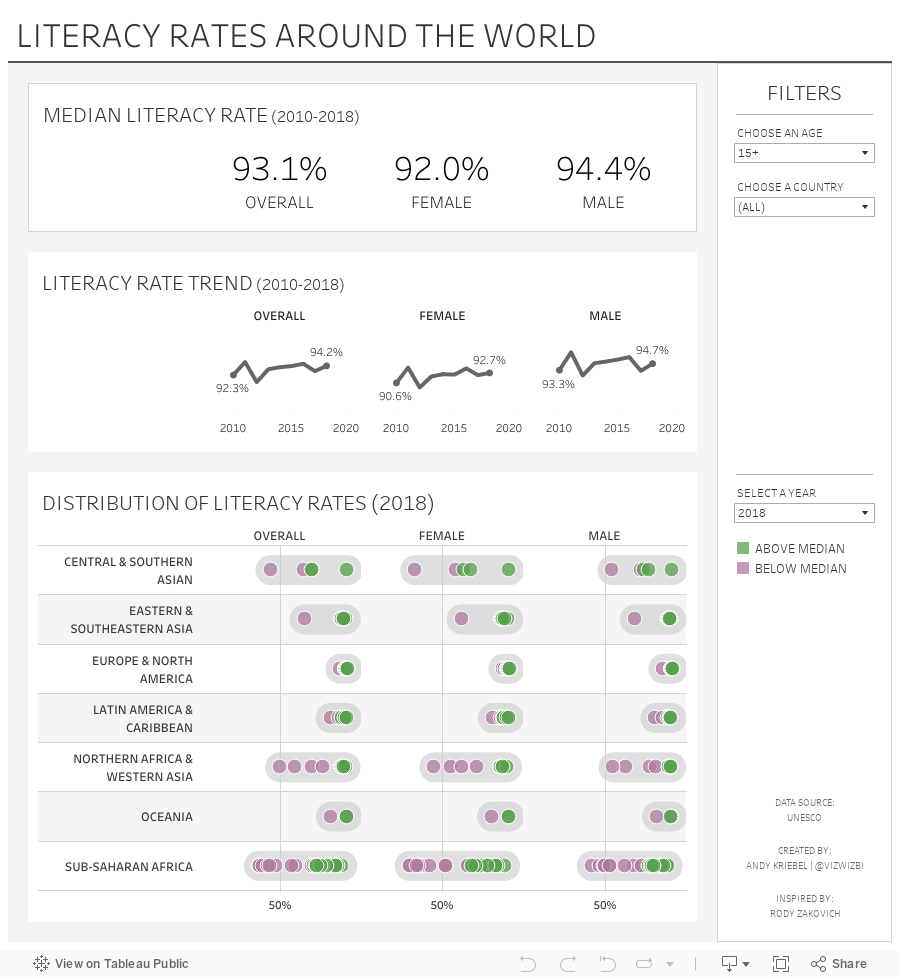
- I created a KPI scorecard so that I could understand the patterns for the overall or an individual country. Are literacy rates improving or regressing?
- Show the distribution of the rates of the countries within each region
- Within each region, which countries are above or below the median for that region?
- How has the literacy rate changed over time?
- Allow simple filtering options.
I drew inspiration from Workout Wednesday week 51 2018: Container Fun from Rody Zakovich. I love finding reasons to practice techniques I've tried before and want to master. Consider challenging yourself to learn something new each week.
Enjoy!
October 7, 2018
Makeover Monday: Five-year Cancer Survival Rates in America
America
,
big numbers
,
cancer
,
line chart
,
Makeover Monday
,
our world in data
,
rates
,
reference band
,
sparklines
,
survival
,
United States
,
USA
No comments

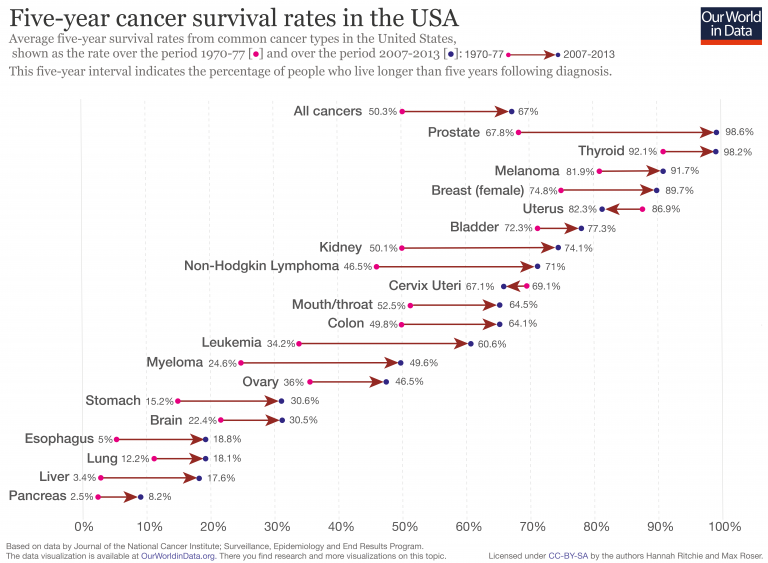
Here's the original viz:
What works well?
- Simple title that explains what the viz is about
- Cancer types are sorted from highest to lowest based on the five-year survival rate
- "All cancers" is sorted at the top since it's the overall statistic
- Using arrows to indicate improving or declining
- Using different colored dots for each time period
- Including an explanation for how the data came about
What could be improved?
- The subtitle is long. I had to read it a couple times to understand it.
- The viz overall feels kind of busy.
- By using directional arrows, the change over time is lost. The change isn't linear, but the design could be interpreted that way.
- Color the arrows by increasing or decreasing. Uterus and Cervix Uteri cancer survival rates have decreased, but that could easily be missed.
What I did
- Incorporatde the change over time
- Used BANs for the first period and the last period measured and the difference
- Used a big dot to indicate a reduction in survival rate
- Used row banding to guide the eye from left to right (taking a lesson from last week's Workout Wednesday)
- Provided an option to filter by race and gender
- Used a set to split the view into the top 9 on the left and the rest on the right; my first version was one long viz, but I didn't like how I had to scroll.
- Used reference bands vertically and horizontally to give the labels space on the ends of the lines
Click on the image below for the interactive version.
May 29, 2017
Makeover Monday: How Has Internet Access Changed Around the World?
accessibility
,
comparison
,
country
,
highlight
,
internet
,
line chart
,
Makeover Monday
,
map
,
rates
,
time series
,
usage
11 comments
For #MakeoverMonday week 22, Eva picked an interactive map from Knoema that shows internet access over time.
| Click image for the interactive version |
What works well?
- Nice interactivity
- Informative tooltips
- Summary in the subtitle provides some context
- Including a definition of an internet user
- Highlighting on the timeline the block for the year you are seeing
- Providing the context of "per 100 people"
- Per 100 people makes it easy to understand because you can think of them like percentages
What could be improved?
- Include a more engaging title.
- Stoplight colors work ok for me, but not for the color-blind folks.
- The color scale in this case makes anything below 75% look bad. Is that really the case? Isn't providing more access over the years more important?
- Why are years without data included on the timeline?
- Having to flick through the years prevents you from seeing the change over time.
- Smaller countries get lost on filled maps
- Needs more context
What were my goals?
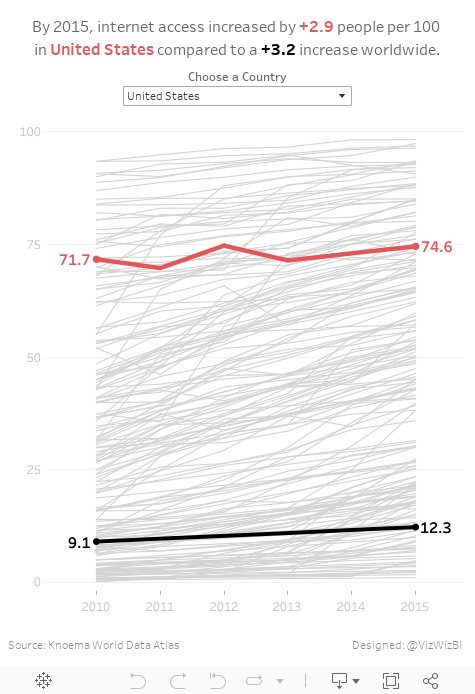
- Create something easy to understand
- Only include 2010-2015 since those were the only reliably consecutive years
- Eliminate countries without values for 2015
- Allow the user to pick a country to spotlight
- Be able to compare that to the worldwide average
- Label the ends of the lines for context
- Include a title with a summary of what happened between 2010 and 2015
With that, here's my Makeover Monday week 22 creation. Enjoy!
Subscribe to:
Posts
(
Atom
)






