July 2, 2017
Makeover Monday: When did Tourism Peak in Berlin?
Berlin
,
black and white
,
Germany
,
heat map
,
Makeover Monday
,
marginal histogram
,
tourism
1 comment
First, let's look at the viz to review:
What works well?
- Using a continuous, single color palette
- Legend is clearly labeled; even though it's in German, I can still understand it.
- Nice interactivity
- Including options to pick the metric
What could be improved?
- The callout for Berlin is confusing since there's no indication that's what was done.
- There's no sense of change over time.
- Need a more informative title.
- The color palette is pretty dull.
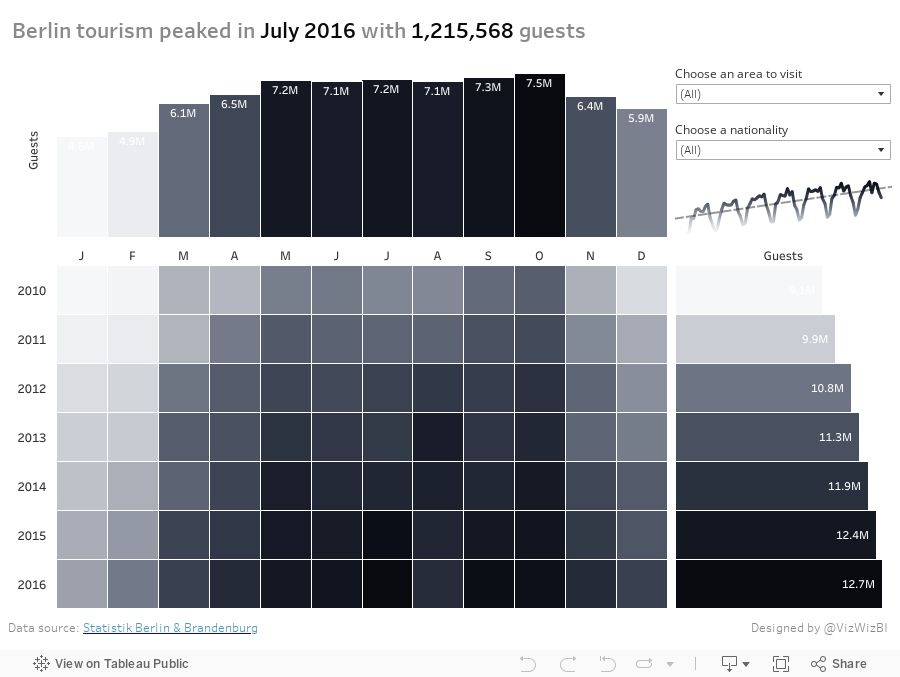
What were my goals?
- Think about what would be important to me as a tourist. Things like time of year to visit, places to visit, who visits, all impact my decisions on when to go places.
- Give an overall historical perspective through the use of a marginal histogram. I was definitely influenced by those created by Sarah Bartlett and Rodrigo Calloni last week.
- In only had about 30 minutes to work on it, so I spent about 5 minutes building the viz and another 25 formatting.
- Go with a black and white theme; actually I used the Facebook grey to black palette.
- Since some of the values go below 1 million, display those in thousands (e.g., 123K).
- Include the max values in the title as BANs.
Subscribe to:
Post Comments
(
Atom
)


It's pretty neat!
ReplyDelete