July 24, 2017
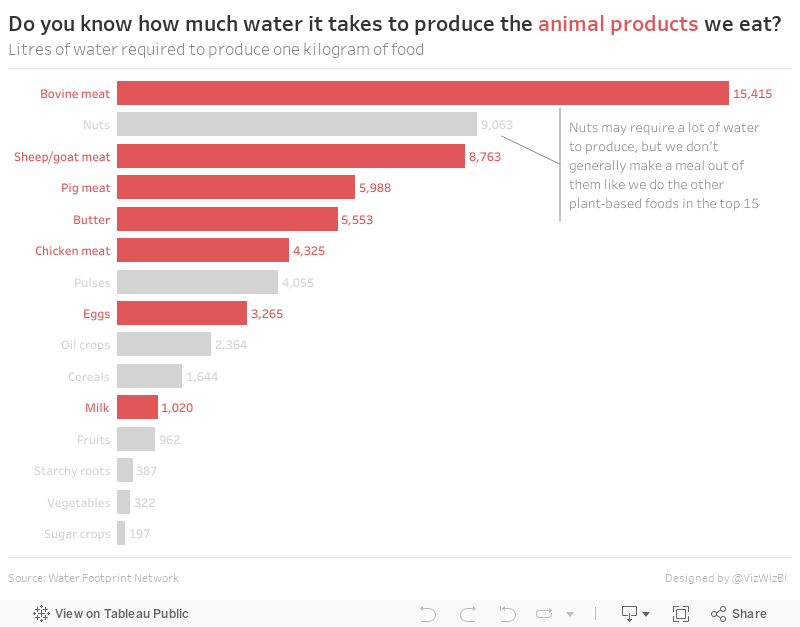
Makeover Monday: Do you know how much water it takes to produce the animal products we eat?

What works well?
- Good title and subtitle
- Sorting the products makes the ranking obvious
- Including the label at the end since the axis is not displayed
- Including the source of the data
What could be improved?
- Using partial icons can be misleading; a simple bar chart would be more accurate
- Shading every other row isn't necessary
- Icons for each food are distracting
- The scale is unnecessary decoration.
- The story in the data, which is referenced in the article, is not alluded to in the viz.
My goals
- Make a simple bar chart
- Use highlighting for the animal products
- Put the title in the form of a question that refers back to the article
With those goals in mind, here's my Makeover Monday week 30.
Subscribe to:
Post Comments
(
Atom
)


One suggestion: "Bovine meat," "pig meat" sounds a little, uh, gross. How about changing the meat products to "Beef, Pork, Chicken" etc. instead?
ReplyDeleteWell, I was making over the original dataset.
Delete