December 4, 2017
Makeover Monday: Comparing the cost of food and drinks at Wetherspoons
cost
,
drinks
,
food
,
Makeover Monday
,
quadrant chart
,
restaurants
,
scatter plot
,
strip plot
,
Wetherspoons
2 comments
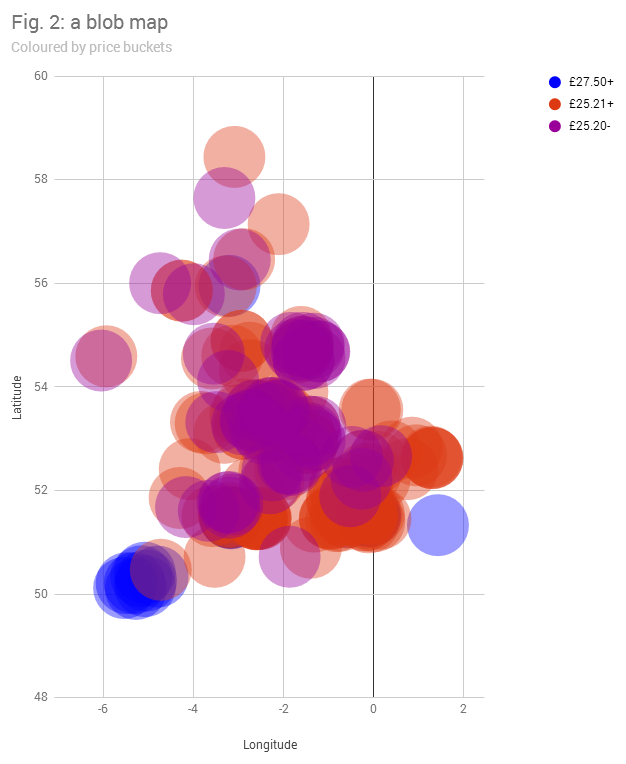
What works well?
- Binning the prices helps cluster the restaurants
- Distinct enough colors
What could be improved?
- The viz is desperately trying to be a map, but failing miserably.
- The dots are so big that they are causing massive overlapping.
- There's no interactivity, so I have no idea which restaurant is which.
- The title doesn't tell me anything.
- What do the dots represent?
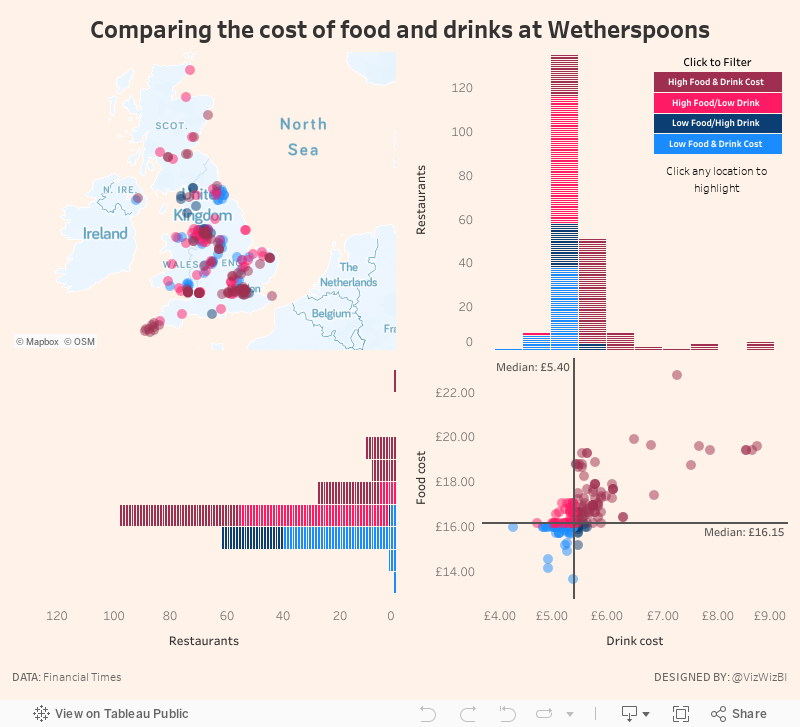
My Goals
- Explore the data, particularly focusing on price comparisons.
- Are there regional differences?
- Do large metro areas charge more?
- Many restaurants make a lot of their money from drinks. Does Wetherspoons?
- Elaborate on the price buckets idea from the original. How are the prices distributed?
- Use FT-themed colors (which you can find here)
- Practice highlight actions so that a restaurant can be more easily found on the map
- Create a custom Mapbox map based on what I learned from our webinar last week.
With these goals in mind, here's my creation for Makeover Monday week 49.
Subscribe to:
Post Comments
(
Atom
)


Hi Andy
ReplyDeleteI really love all your data visualization work. Your agility in using the Tableau tool fascinates me. You are a real source of inspiration. Thank you for everything you do for the community and continue like this.
Nice MO. It took me some time to understand that stacked bars are extention of scatterplot axis. Very smart. Now I clearly see that number of restaurants with low food / high drink is the least. What I would add is number of restaurants in each cell of scatterplot.
ReplyDelete