September 25, 2017
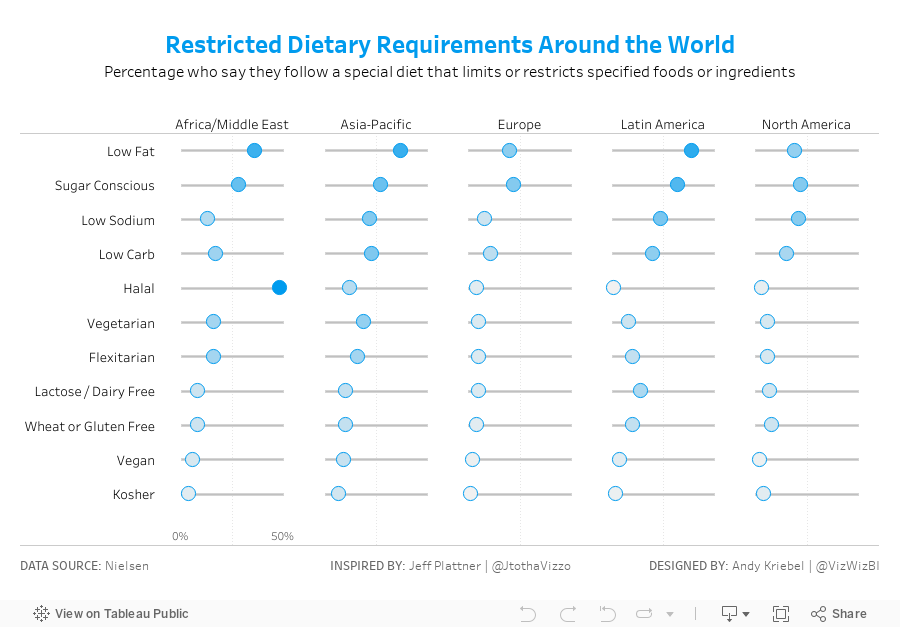
Makeover Monday: Restricted Dietary Requirements Around the World | Dot Plot Edition
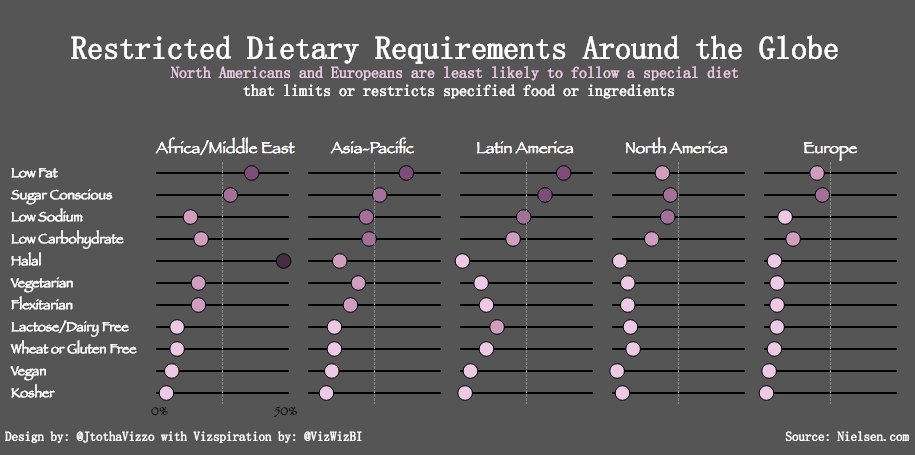
Jeff used this video from my Tableau Tip Tuesday series to create his dot plot. I love how clean his design is and I hadn't built something like this in a while so I thought I'd give it a go. I chose a color scheme that matches the Nielsen colors, but otherwise, it's pretty much identical.
Thanks for the inspiration Jeff!!
Subscribe to:
Post Comments
(
Atom
)


No comments
Post a Comment