Showing posts with label inspiration. Show all posts
August 1, 2022
Why I started using Tableau
advice
,
Atlanta Tableau User Group
,
ATUG
,
career
,
coca-cola
,
facebook
,
getting started
,
inspiration
,
tableau
,
Tableau Conference
,
tcc08
,
tip
No comments
September 25, 2017
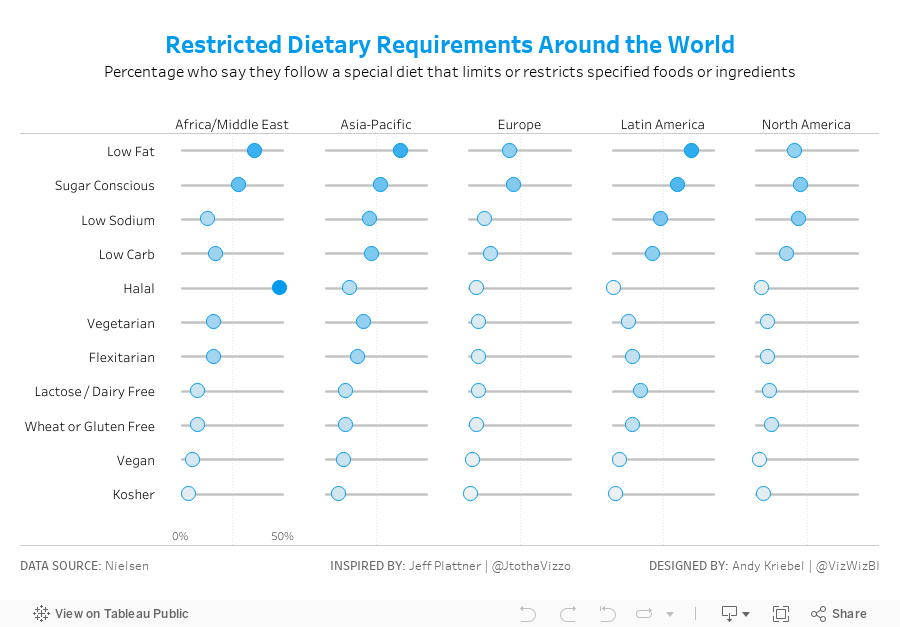
Makeover Monday: Restricted Dietary Requirements Around the World | Dot Plot Edition
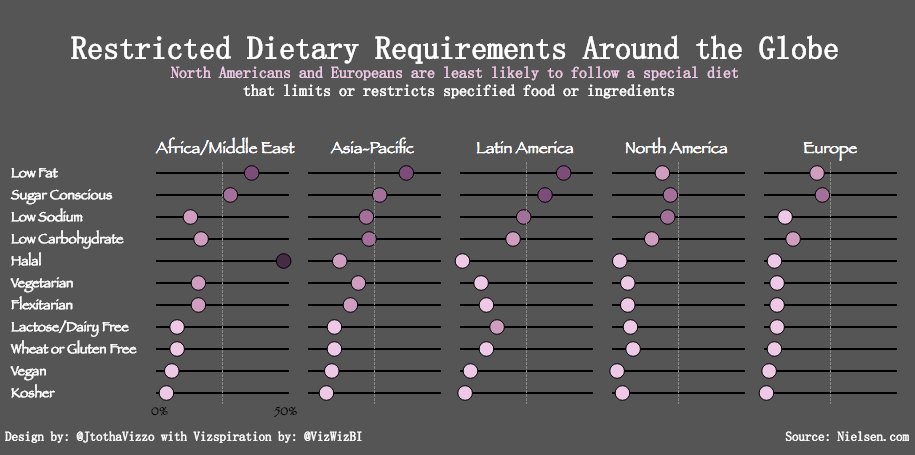
Jeff used this video from my Tableau Tip Tuesday series to create his dot plot. I love how clean his design is and I hadn't built something like this in a while so I thought I'd give it a go. I chose a color scheme that matches the Nielsen colors, but otherwise, it's pretty much identical.
Thanks for the inspiration Jeff!!
September 23, 2017
Vizspiration: Chicago Taxi Trips from Near North Side
Chicago
,
gantt
,
inspiration
,
reviz
,
Suraj Shah
,
taxi
No comments

With his permission, I wanted to try to remake his viz with a different data set. On the last day for DS6 at The Data School, they had a two hour task of creating a viz with the Chicago Taxi data that we used for MM week 6. I figured this might be a perfect data set to give it a go.
I don't like mine nearly as much as Suraj's. It sure was fun creating it though. It took me about 45 min total. There's nothing very complicated about the viz itself, and it's probably this simplicity that I like the most.
Thanks Suraj for the inspiration!! Click on the image below for the interactive version.
May 11, 2012
Get your Tableau Viz of the Day and get Tableau daily goodness
Ben Jones
,
data remixed
,
data viz
,
examples
,
gallery
,
inspiration
,
samples
,
tableau
,
tableau public
,
visualization
1 comment
If you're anything like me, you love finding awesome, innovative Tableau visualizations. I get so much inspiration from the Tableau Public Gallery and an ever growing list of bloggers.
As of today, Tableau will be "sharing one beautiful visual story a day". How cool is that?
Subcription/follow options include:
As of today, Tableau will be "sharing one beautiful visual story a day". How cool is that?
Subcription/follow options include:
Their first daily viz is by Ben Jones of Data Remixed. If every viz of the day is anywhere near the quality of Ben's, we're in for a real treat.
Subscribe to:
Posts
(
Atom
)






