Showing posts with label Tableau Conference. Show all posts
August 1, 2022
Why I started using Tableau
advice
,
Atlanta Tableau User Group
,
ATUG
,
career
,
coca-cola
,
facebook
,
getting started
,
inspiration
,
tableau
,
Tableau Conference
,
tcc08
,
tip
No comments
October 24, 2018
Workout Wednesday: Where should we focus our sales effort?
#TC18
,
level of detail
,
LOD
,
map
,
table calc
,
Tableau Conference
,
Workout Wednesday
No comments
This week's Workout Wednesday was a live edition at TC18 hosted by Ann Jackson and Luke Stanke. You can get the challenge requirements here. I worked with Lorna Eden (former Data Schooler) and we nearly finished in the allocated time; the only part we could get quite right was the shapes.
I headed back to my hotel room after the session because I had to finish it (plus I have a presentation to work on). What we did wrong was quite a dumb oversight. In the calculation to create the shapes, we were using the wrong dimension. How dumb of us!
Anyway, we're done now. It was really fun to try to get it done in 50 minutes. So close!
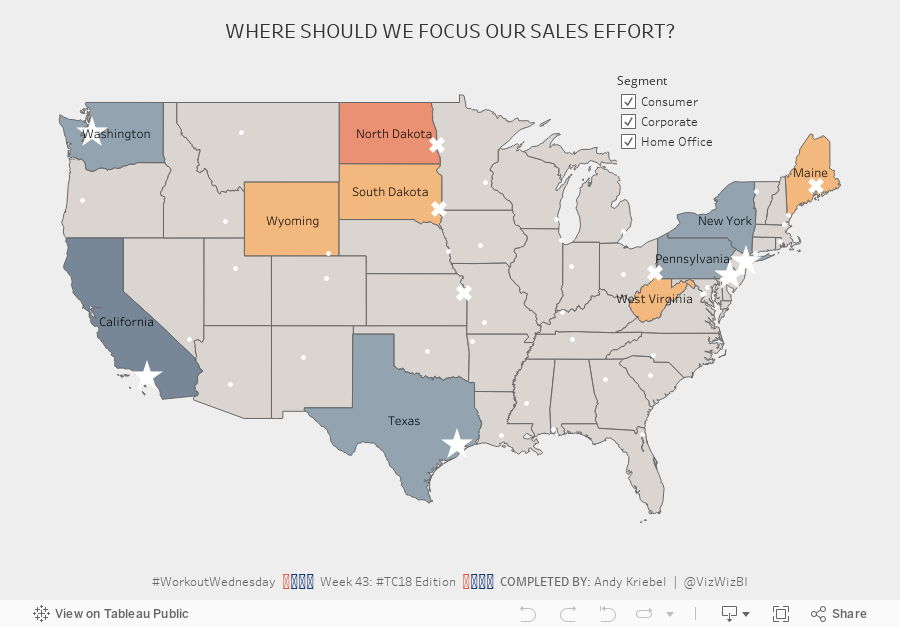

I headed back to my hotel room after the session because I had to finish it (plus I have a presentation to work on). What we did wrong was quite a dumb oversight. In the calculation to create the shapes, we were using the wrong dimension. How dumb of us!
Anyway, we're done now. It was really fun to try to get it done in 50 minutes. So close!
September 29, 2017
Announcing the #RunData17 routes
Data17
,
Las Vegas
,
routes
,
RunData17
,
running
,
Tableau Conference
,
TC17
No comments

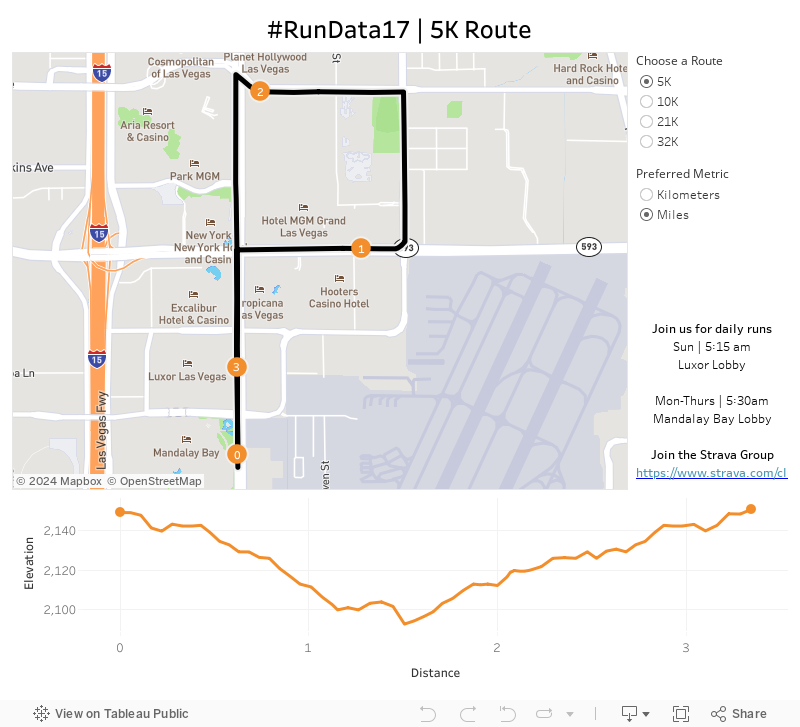
Given the conference is significantly larger this year, I bet we can double it! There are 5K, 10K and 21K options and all different paces. Want to go set a land speed record? Go for it! Want to walk? That's fine too! The point is to get out and start your day the right way...with a run!
The run start and end at the Mandalay Bay lobby. We'll start at 5:30am, so get there a few minutes early to sign a waiver and for a group photo.
To help you, I've created this dashboard so you know the routes. It's mobile friendly too!
I hope to see you in Vegas!
June 11, 2017
Viva Las Vegans! An Iron Viz Entry
data.world
,
iron viz
,
Las Vegas
,
map
,
Tableau Conference
,
vegan
,
vegetarian
,
web data connector
No comments
This also gave me a chance to test the new web data connector from data.world. One of the data sets is a list of over 18,000 restaurants that serve vegetarian or vegan food in the US. I took this list, narrowed it down to Las Vegas, eliminated and closed restaurants and joined it to a Excel files that has the websites for each restaurant.
It's not anything too complicated nor flashy, but here's to hoping that practicality and usefulness is important to the judges as well. I've also designed it for mobile!
Enjoy!

November 29, 2016
86 Tips in 45 Minutes | Our Presentation from DATA16
Austin
,
data+science
,
data16
,
Jeffrey Schaffer
,
Tableau Conference
,
Tableau Tip Tuesday
,
tips
,
tricks
1 comment

Our goal going into the session was to see if we could get to 50 tips in 50 minutes. Right before we started, we decided to let our wonderful judges and the audience count the tips. Why? Because Jeff and I have been using Tableau for a long time and sometimes we do things that come second nature to us that others didn't know.
This was BY FAR the most fun presentation I've ever given or been a part of. Thanks Jeff for being a great partner!!
If you'd like to follow along, you can download the workbook of my tips here.
My advice, pause the video along the way and try to reproduce the things I do using the starter workbook. Have fun!
October 14, 2016
Join us at #RunData16!
Austin
,
meetup
,
rundata16
,
running
,
strava
,
Tableau Conference
,
TC16
No comments


For the past few Tableau Conferences, members of the Tableau Community have come together for some early morning running. Last year, as you can see above, we had an incredible turnout and we expect this year to be much more of the same.
Details:
- When: 5:30am Mon, Tue, Wed
- Where: Four Seasons
- Distances: 5K and 10K (easy enough to make longer or shorter if you'd like)


- Run leaders: Eva Murray, Paul Chapman, Me
- More info on Strava
Yes, a 5:30am start time is early, but in our experience, you HAVE TO start this early if you want time to make the keynotes. Running people are a weird bunch anyway, so 5:30 is never too early for us!
The run leaders will have high visibility bibs and torches for everyone's safety. If you have lights, bring them along. I've run these routes many times and it's a beautiful trail along the river. There are always tons of runners out and about.
NOTE: You may see a meetup list on the conference website, but it doesn't start until 6:30. If you go to that one, you have very, very little chance of making the keynotes. Plus, most of the runners will be at our run. And we'll be done before they even start!
Tableau has informed us that they will not be supporting us this year. However, keep up with the #RunData16 hashtag on Twitter for all of the latest information. See you in Austin!
October 21, 2015
Makeover: The Billion Dollar Startup Club
Today at the Tableau Conference keynote, Dave Story introduced the crowd to Vizable, the first time Tableau has launched a new product at its conference. I immediately downloaded it and have already built three simple charts that took no more than a few minutes each.
As a use case, let’s look at this viz from The Wall Street Journal.

This is cute, but completely ineffective as a design. Comparisons are nearly impossible. I copied the data from the webpage, saved it into Excel in OneDrive, opened Vizable, connected to the data, and built this simpler bar chart alternative, all in about 2 minutes.

Tableau has yet again gotten me addicted...quickly. I can see many great uses for Vizable already. Go download it and play. It’s completely free.
As a use case, let’s look at this viz from The Wall Street Journal.

This is cute, but completely ineffective as a design. Comparisons are nearly impossible. I copied the data from the webpage, saved it into Excel in OneDrive, opened Vizable, connected to the data, and built this simpler bar chart alternative, all in about 2 minutes.
October 14, 2015
Recommended Sessions for the Tableau Conference
As I sit in the Virgin lounge at Heathrow airport, I thought I’d quickly share my recommended sessions for the Tableau Conference. If this is your first Tableau Conference, you’re in for quite a treat. It’ll be an amazing experience and it will feel overwhelming. With a little planning you’ll be fine.
My best advice:
Here are the sessions I plan to attend. Note, the #RunData15 events are early on Tues/Thurs and we’ll leave from the MGM lobby promptly at 5:15am.


My best advice:
- Choose at least 2 sessions per time slot (in case you don’t get in your first choice)
- If a session sucks, get up, walk out and go to another session. Don’t worry about hurting the speaker’s feelings. They’re the reason you’re leaving in the first place. After all, you paid to be there, so you need to get the most out of it.
- All sessions that are led by Tableau employees are recorded, so if there’s a conflict, that could help you decide which one to skip.
- Absolutely DO NOT MISS the IronViz! It’s far and away my favorite session.
- Get to sessions early so you can get a seat, then go out and get a drink and use the facilities.
- Drink lots of water. These will be long, exhausting days (and nights) and the last thing you need is to be dehydrated in the desert.
- Meet as many people as you can. Find the people you follow on Twitter and say hi to them. I love it when I meet new people.
Here are the sessions I plan to attend. Note, the #RunData15 events are early on Tues/Thurs and we’ll leave from the MGM lobby promptly at 5:15am.
July 2, 2015
Tableau On Tour London - My Agenda & Other Happenings
agenda
,
Data15
,
London
,
Tableau Conference
Tableau On Tour comes to London next week. This will be my first conference as a partner, so I’m interested to see how the experience is different. You’ll likely be able to find me hanging around The Information Lab booth, which you won’t be able to miss in all of its orangeness.
First, I know I won’t be able to compete in the Information Lab Speed Challenge.

But you can, and you can win a drone. This year’s challenge include a bit of Alteryx as well. If you’re not an Alteryx user yet, ask us for help. Don’t worry, the Alteryx piece will be simple enough for anyone to follow along, even a brand new user.
I’m very excited to be hosting a breakfast Wednesday morning with founder, boss and friend Tom Brown. We’re going to be talking about the Data School and how the experts we’re building will be instrumental in the world of data analytics. If you think you’re company would like to take on one of these consultants for a 6-month engagement after their training is complete or if you’d like to have the School do a 1-week project for free with your company’s data, email me and I’ll get you into the breakfast. Trust me, this isn’t a group of talent you want to miss out on.
The consultants at the School will be very visible throughout the conference. If you see one of them, stop them and ask how things are going. Ask them to show you what they’re working on. Find out how much they’ve learned in only two weeks of training.
Lastly, I thought I’d share my agenda. I’m hoping I get to go to this many sessions, but I’m fairly sure things will change. I’d always rather talk shop in the hallways than go to sessions. These types of conversations are what the Tableau community and Tableau conferences are all about; these are how you get value from them.


See you at The Brewery Monday!
First, I know I won’t be able to compete in the Information Lab Speed Challenge.
But you can, and you can win a drone. This year’s challenge include a bit of Alteryx as well. If you’re not an Alteryx user yet, ask us for help. Don’t worry, the Alteryx piece will be simple enough for anyone to follow along, even a brand new user.
I’m very excited to be hosting a breakfast Wednesday morning with founder, boss and friend Tom Brown. We’re going to be talking about the Data School and how the experts we’re building will be instrumental in the world of data analytics. If you think you’re company would like to take on one of these consultants for a 6-month engagement after their training is complete or if you’d like to have the School do a 1-week project for free with your company’s data, email me and I’ll get you into the breakfast. Trust me, this isn’t a group of talent you want to miss out on.
The consultants at the School will be very visible throughout the conference. If you see one of them, stop them and ask how things are going. Ask them to show you what they’re working on. Find out how much they’ve learned in only two weeks of training.
Lastly, I thought I’d share my agenda. I’m hoping I get to go to this many sessions, but I’m fairly sure things will change. I’d always rather talk shop in the hallways than go to sessions. These types of conversations are what the Tableau community and Tableau conferences are all about; these are how you get value from them.


See you at The Brewery Monday!
Subscribe to:
Posts
(
Atom
)






