Showing posts with label vegan. Show all posts
June 8, 2020
#MakeoverMonday Week 23 - Frequency of Meat-Free Consumption by Brits in 2019
highlight
,
level of detail
,
Makeover Monday
,
meat
,
parameter
,
statista
,
UK
,
united kingdom
,
vegan
,
vegetarian
No comments
Week 23 was a pretty straight forward data set. It focuses on the frequency with which Brits of different diet types have consumed meat-free foods. Somehow meat-eaters have NEVER eaten meat-free food. No fruits or veggies? Ever?
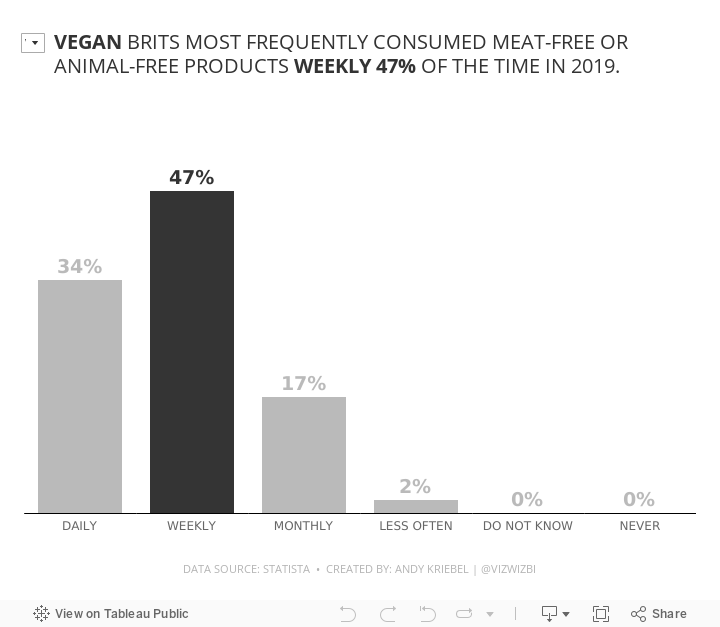

And what about the vegans? This data says they most frequently eat meat-free food weekly. Huh? They're vegan; they eat meat-free food every meal.
I'm skeptical of this data. Anyway, here's my viz.
December 9, 2018
Makeover Monday: How much land is needed to produce our food?
animal products
,
animals
,
food
,
highlight
,
Makeover Monday
,
reference line
,
vegan
,
vegetarian
,
waterfall
No comments

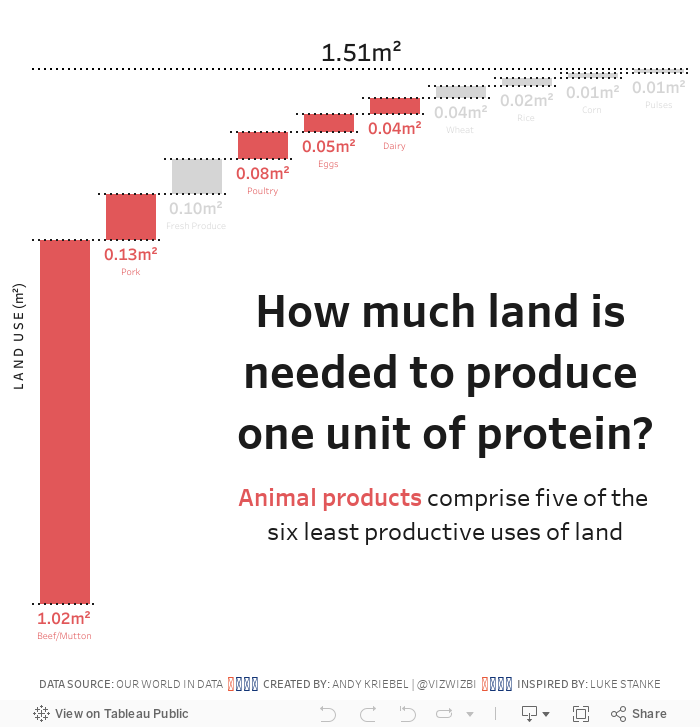
- A 9oz/251g steak contains 62g of protein.
- Multiply that by 1.02m² (the amount of land needed to produce 1g of steak)
- It takes 63.25m² of land to produce ONE STEAK. That's 678ft² for my American friends.
SERIOUSLY! WTF!
That's like a one bedroom apartment for every 10oz steak. That's ridiculous and a major reason why I went vegetarian 18 months ago.
Let's have a look at this week's chart:

What works well?
- Using a descending bar chart for ranking from largest to smallest
- Labeling the ends of the lines for more precision
- Simple title
What could be improved?
- It took me several times to read the subtitle to make sense of it. Something simpler would be helpful.
- Remove the gridlines
- Remove the axis
What I did
- Recreated the waterfall chart that I had to create for Workout Wednesday week 49
- Used color to highlight the food types that come from animals; I used red to represent bad (my opinion)
- Change the title into the form of a question
- Included a BAN to summarize the findings
With that, here's my Makeover Monday week 50.
September 24, 2017
Makeover Monday: Restricted Dietary Requirements Around the Globe
arc
,
bar chart
,
curve
,
diet
,
Makeover Monday
,
narrative
,
story
,
vegan
,
vegetarian
No comments

What works well?
- Consistent ordering of the countries within each diet type
- Colors are easy to distinguish from one another
- Arcs, while not best practice, are engaging and capture your attention
- Subtitle that explains what the viz is about
What could be improved?
- Comparing the length of arc is difficult, especially across diet types.
- The icons are not needed since each diet is already labeled.
- The story in the data is lost as it's not included along with the charts.
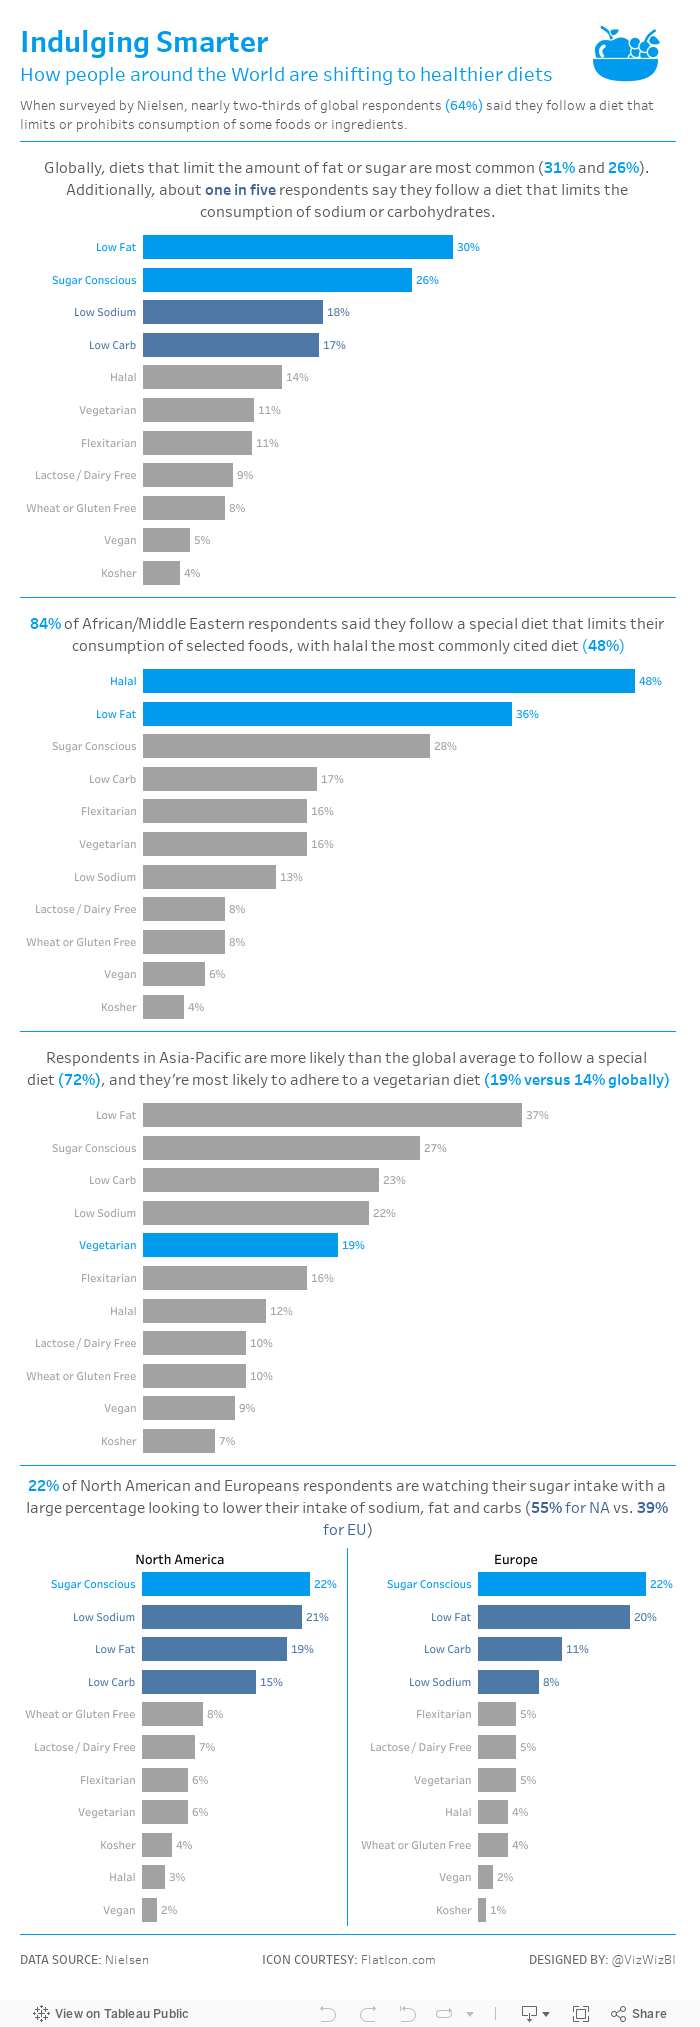
My goals
- Simplify the visualisation; bar charts are a good place to start.
- Turn the text from the previous page that explains the findings into a story of some sort, probably long form and not story points.
- Remove the icons
With those goals in mind, here's my Makeover Monday week 39.
June 11, 2017
Viva Las Vegans! An Iron Viz Entry
data.world
,
iron viz
,
Las Vegas
,
map
,
Tableau Conference
,
vegan
,
vegetarian
,
web data connector
No comments
This also gave me a chance to test the new web data connector from data.world. One of the data sets is a list of over 18,000 restaurants that serve vegetarian or vegan food in the US. I took this list, narrowed it down to Las Vegas, eliminated and closed restaurants and joined it to a Excel files that has the websites for each restaurant.
It's not anything too complicated nor flashy, but here's to hoping that practicality and usefulness is important to the judges as well. I've also designed it for mobile!
Enjoy!

Subscribe to:
Posts
(
Atom
)






