January 17, 2018
Creating Maps With Linear Geometries in Tableau
This blog post is a couple months late as Tableau added support for linear geometries in version 10.4. So what are linear geometries? Essentially the are spatial files that are represented as a single line.For example, let's say you have a series of locations that represent train stops. In Tableau you can draw the route by connecting the dots via the line shelf. This will result in marks for every station. If the route is a linear geometry (or linestring) instead, it is represented in Tableau as a single mark, meaning the viz will load much faster.
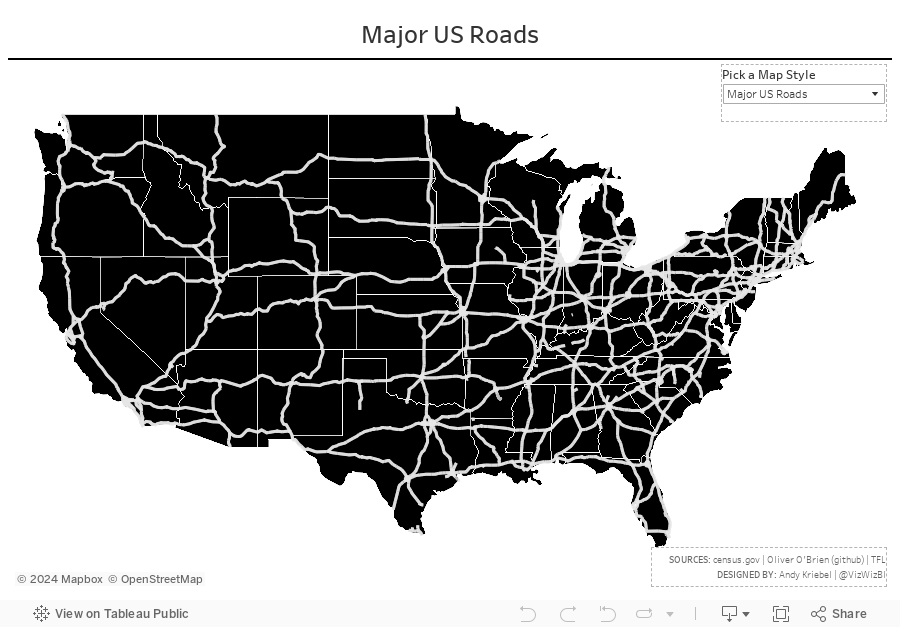
This is useful if you each point isn't important and you care more about the path itself. To help me understand how these work I downloaded shapefiles from the US Census, github and Transport for London. Each of these was a linear spatial file already, meaning I could connect with Tableau and go.
If I had a series of points, like the train stops example, I could use Alteryx to convert them to spatial points, create the path and export as a shapefile.
With that, here are a few example I've built using linear geometries and custom Mapbox maps. Note that the maps may be slow to load in Tableau Public. I'm not sure why because they're super fast in Desktop. Enjoy!
Subscribe to:
Post Comments
(
Atom
)


No comments
Post a Comment