Showing posts with label Harry Enten. Show all posts
July 19, 2017
Trump is Historically Unpopular
approval ratings
,
Donald Trump
,
fivethirtyeight
,
Harry Enten
,
highlight
,
makeover
,
President
,
slope graph
3 comments

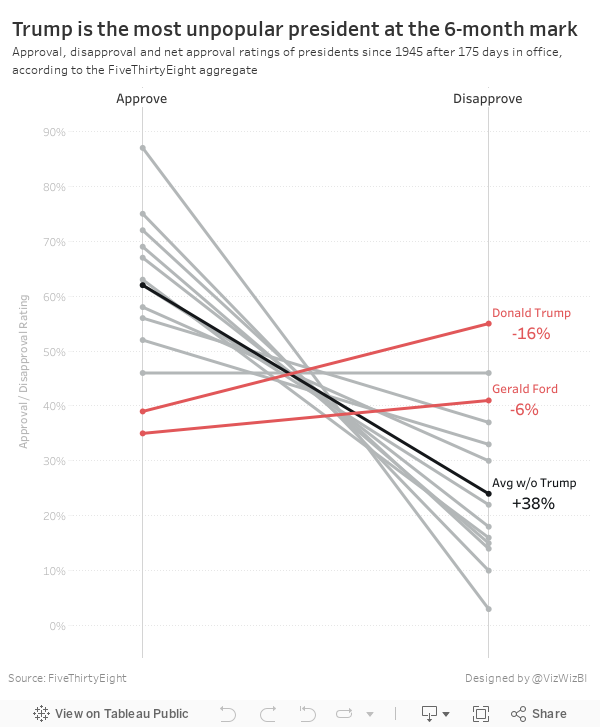
The table is ok in that it lists the presidents in descending order by net approval rating. However, I thought a visual display would be more effective. I used Google Sheets to import the table and quickly connected it to Tableau and built a slope graph to more effectively display the data.
It only took about 15 minutes to build this, so I'm surprised FiveThirtyEight didn't include a visual. I wonder what their reasoning is for including a chart vs. a table. What do you think? Which view works better for you?
January 26, 2017
Makeover Monday: Regional Tourism Spending in New Zealand (Take 3)
dot plot
,
Eva Murray
,
Harry Enten
,
Makeover Monday
,
median
,
New Zealand
,
percentiles
,
tourism
Inspired by the visualisation by Harry Enten that I highlighted today on my sister site DataVizDoneRight, I decide to look at the New Zealand tourism data again and see if I could build a similar view. After all, no data visualisation is ever “complete”. I really like how this turned out (and thank you to Eva Murray for feedback).
I incorporated a legend on the upper right to make the bars easier to interpret. Basically the grey bar shows the 25th to 75th percentile of all of the regions and the red dot indicates the median of all regions. I’ve removed the total region from the view.
Subscribe to:
Posts
(
Atom
)