Showing posts with label bubbles. Show all posts
March 2, 2021
How to Create a Circle Timeline
bubble timeline
,
bubbles
,
circle
,
circle timeline
,
color
,
date
,
dot plot
,
formatting
,
how to
,
packed bubbles
,
tableau
,
tableau circle timeline
,
time series
,
timeline
,
tip
No comments

A circle timeline combines a time series, a dot plot, and packed bubbles into the same view.

June 10, 2018
Makeover Monday: Tourism Density Index
bubbles
,
comparison
,
country
,
density
,
index
,
Intrepid Adventure
,
Makeover Monday
,
tourism
No comments

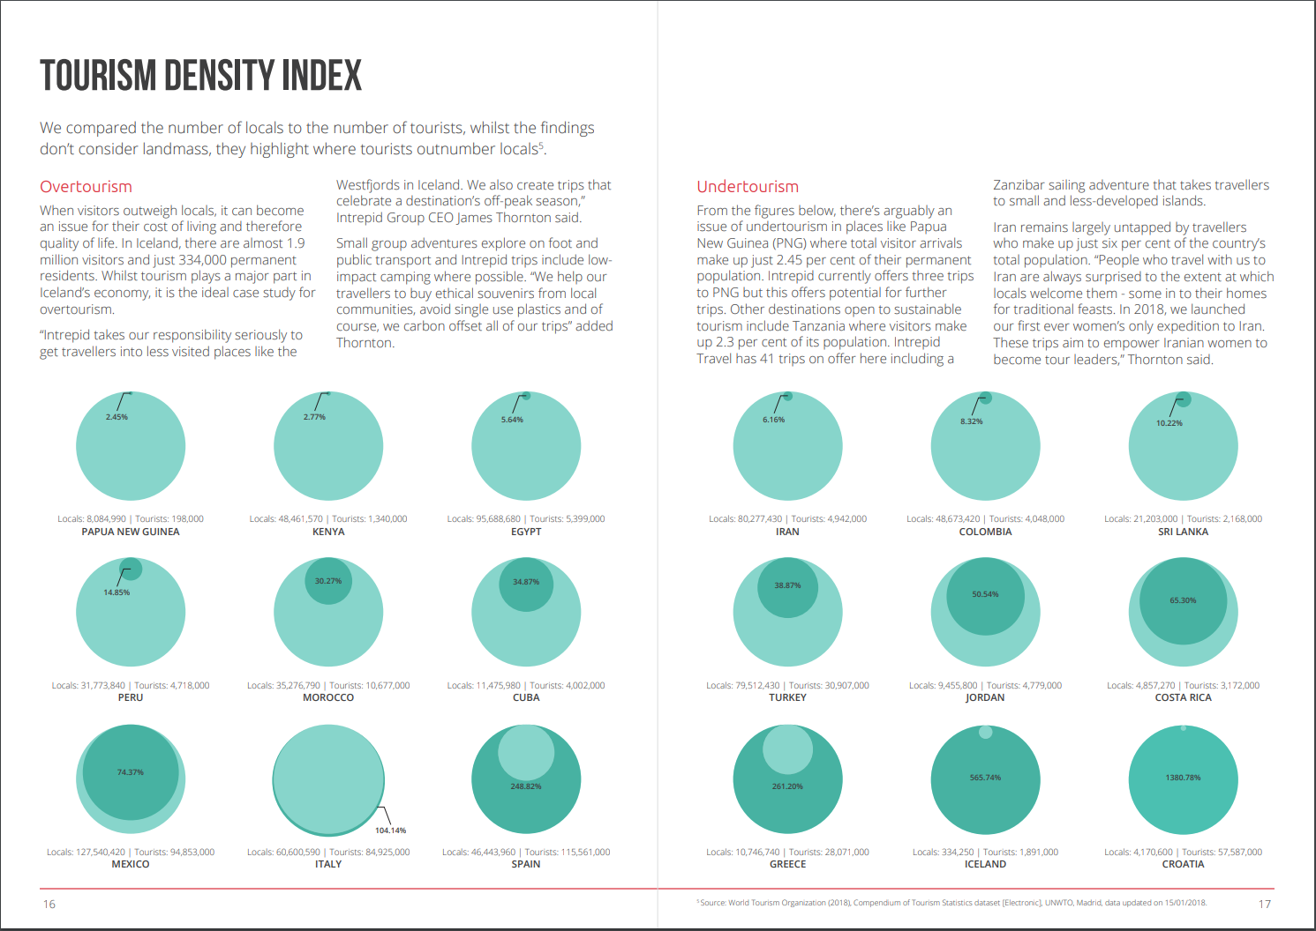
What works well?
- Really good explanations for how they define overtourism and undertourism and examples for each
- Providing the exact figures for each country
- Colors are easy enough to distinguish
- Sorting the countries from lowest to highest
- Splitting the view between the highest 9 and the lowest 9
What could be improved?
- Circles are inherently difficult for comparisons. Are they measure by area or diameter? Either way, the circle in a circle in overkill.
- Why does the size of the light green circle change once the dark green circle is a larger value? That makes no sense at all.
- If the exact numbers were not included, it would be impossible to compare countries.
- Why show the top 9? That seems like an unusual way to select the countries.
My Goals
- Focus on either the raw values or the percentages. I'll figure this out once I explore the data.
- Make it easier to compare countries.
Subscribe to:
Posts
(
Atom
)


