May 9, 2017
Tableau Tip Tuesday: Using LOD Expressions to Color Lines By the Most Recent Value
date
,
fixed
,
latest
,
level of detail
,
line chart
,
LOD
,
most recent
,
nested
,
Tableau Tip Tuesday
2 comments
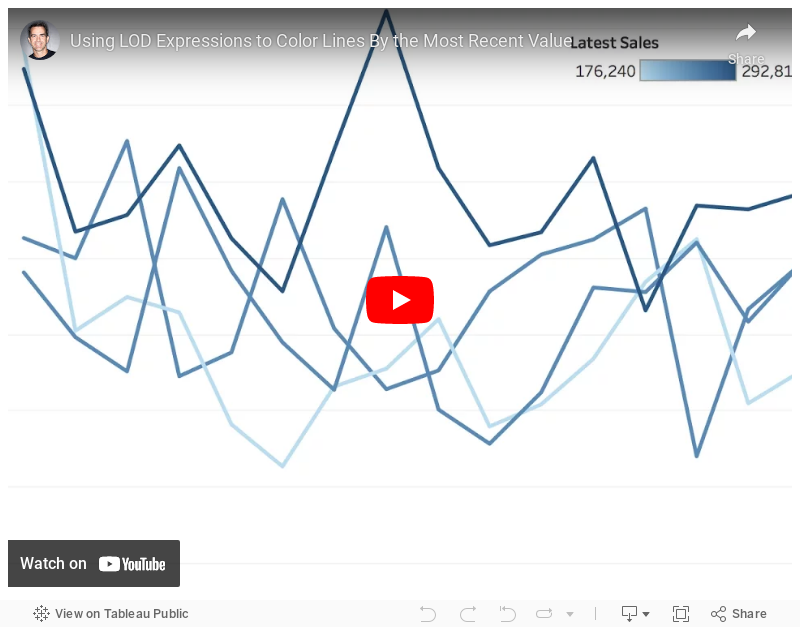
How can I color each line on a line chart by the most recent value?This requires a three-pass LOD expression. The key is to realize that Tableau created an aggregate table for each LOD working from the inside out. So
- Tableau calculates the inside LOD first.
- Then the second LOD is calculated based on the results of the first LOD.
- Then the third LOD is calculated based on the results of the second LOD.
Make sense? I hope so! If not, let me know. Enjoy!
Subscribe to:
Post Comments
(
Atom
)


How is the following modification to your `Latest Sales` different?
ReplyDelete```
// For each region, calculate the maximum quarter
// Then for each region, return the latest quarter of sales
{ FIXED [Region] :
SUM(
IF DATETRUNC('quarter',[Order Date])=
{FIXED [Region] : MAX(DATETRUNC('quarter',[Order Date]))}
THEN
[Sales]
END
)}
```
Great catch Brian! I do indeed have an unnecessary LOD in there. I've updated the viz. Thanks!!!
Delete