August 7, 2018
Makeover Monday: Jumpy Curvy European Irish Whiskey Sales
BordBia
                                ,
                              
curve plot
                                ,
                              
europe
                                ,
                              
Information Lab
                                ,
                              
ireland
                                ,
                              
irish
                                ,
                              
jump plot
                                ,
                              
Makeover Monday
                                ,
                              
Nils Macher
                                ,
                              
sales
                                ,
                              
The IWSR
                                ,
                              
whiskey
No comments
|  | 
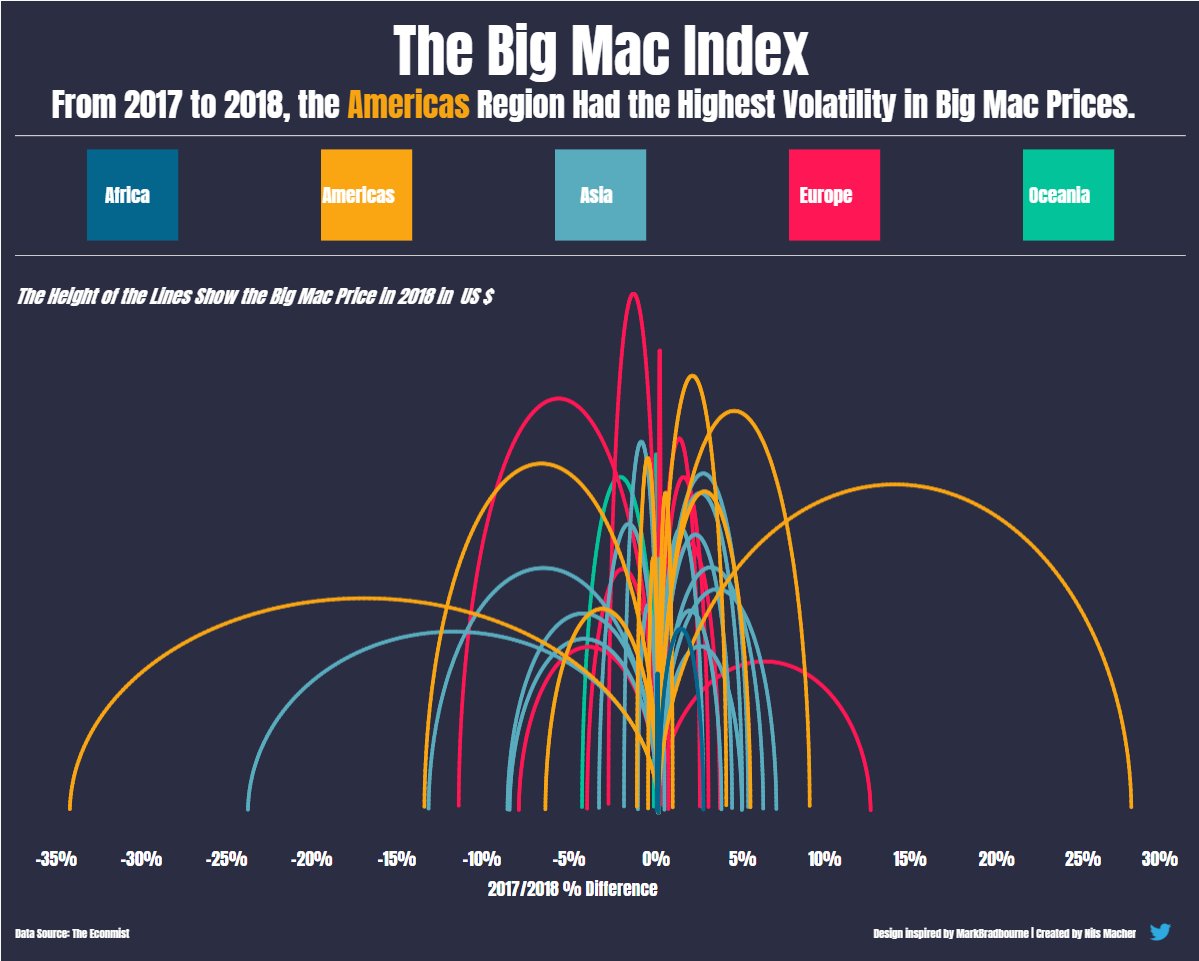
| Nils' viz inspired by Mark Bradbourne | 
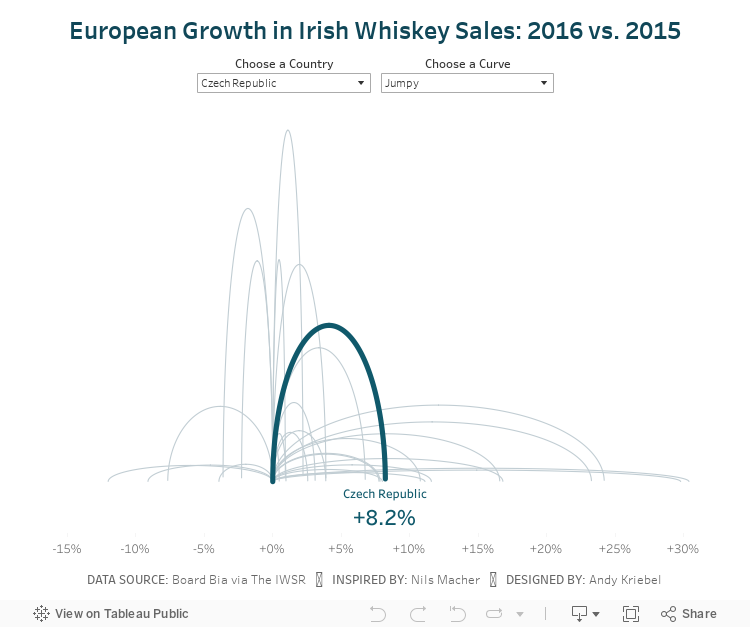
Today, Nils taught us how he shaped the data and built the viz, then we each took a Makeover Monday data set and applied what we learned. I chose to use the Irish Whiskey sales data from week 11.
I started by shaping the data in Alteryx via these steps in my workflow:

I then created a jump plot similar to Nils and also found a curvy plot interesting too, so I decided to include both via a parameter. Another fun day of learning! Never stop!
Subscribe to:
Post Comments
                        (
                        Atom
                        )


No comments
Post a Comment