December 22, 2019
#MakeoverMonday: How much are Brits & Europeans expected to spend on Christmas?
british
,
Christmas
,
Deloitte
,
europe
,
Makeover Monday
,
survey
,
UK
,
united kingdom
No comments

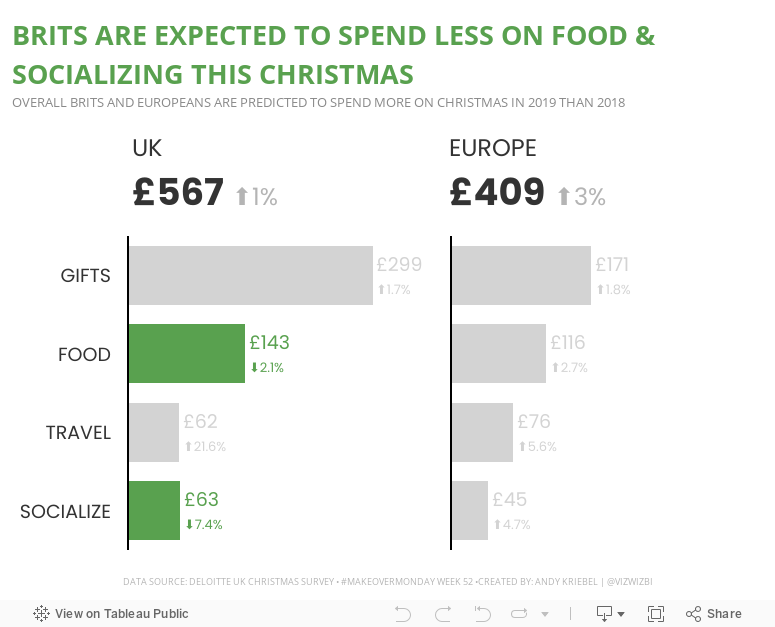
This week, Eva picked Christmas-themed data...a simple survey from Deloitte about expected Christmas spending and the UK and Europe.

What works well?
- It a simple table that is easy to understand without doing much thinking.
- My eyes were immediately drawn to the two red declining arrows, which makes it seem to be the focus on the visualization.
- The table is neatly organized from highest to lowest spending categories.
- Everything is clearly labeled.
- The highlight box on the right provides a nice summary.
What could be improved?
- Remove the shading from 2018
- Removed the shading from the background of the Total cell
- Align the text labels either left of right, but not center
- Remove the borders between the rows, but keep them to separate the headers and totals from the rest of the table
- Change the font color of the categories to black; green could give the impression that they are increasing
- Align the arrows on the second table with the rows they correspond to
- Why is spending less red? I would think spending less is good
Taking all of this into account, here's my Makeover Monday week 52. Enjoy!

Subscribe to:
Post Comments
(
Atom
)


No comments
Post a Comment