August 25, 2015
Tableau Tip Tuesday: How to Show Bars and Dots in the Same Graph

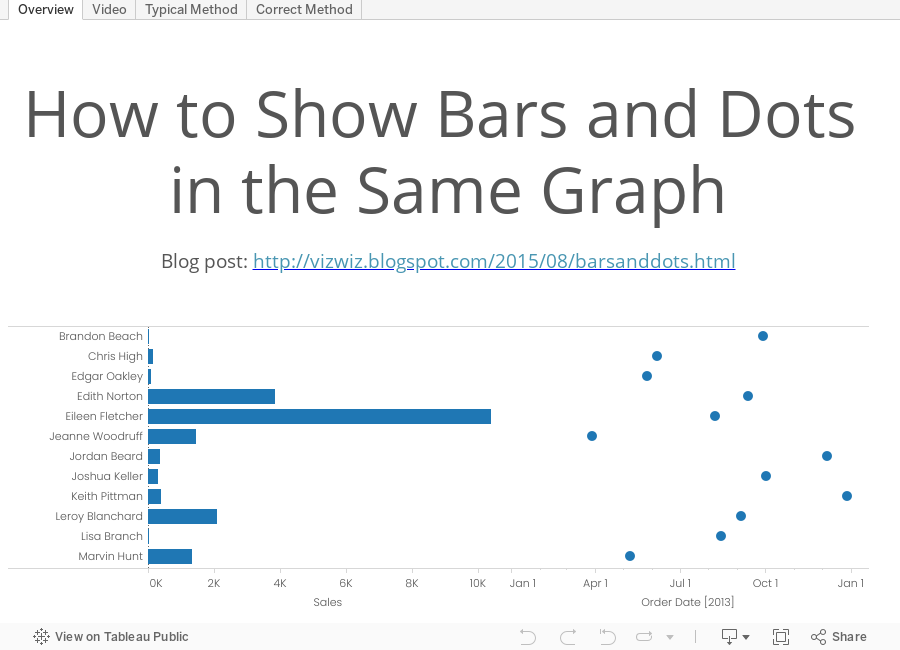
This week's tip came about based on a Server admin view that Ravi Mistry of the Data School created. In Ravi's view, he created two charts, a bar chart and a dot plot, and placed them side-by-side in a dashboard. After his demo, I showed him how he could combine them into a single view, which is what I'm showing in this week's tip.
Subscribe to:
Post Comments
(
Atom
)


Hi Andy,
ReplyDeleteThis a great tip.
For information, you can deactivate the sorting by using a table calc. Replacing Sum([Sales]) by WINDOW_SUM(SUM[Sales])) computed at the cell level will show the same data with no sorting capability. Your way is still way better.
Damien.
Good point Damien...thanks!
Delete