August 26, 2015
Dear Data Two | Week 20: Interesting Things

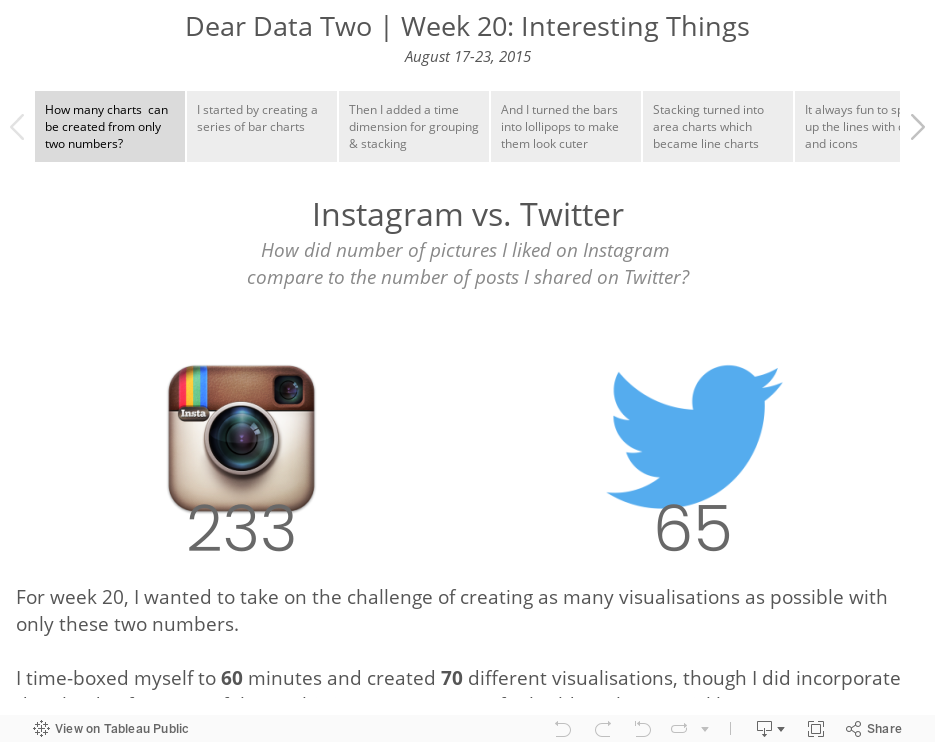
The topic for week 20 of Dear-Data-Two was "interesting things". I started the week by recording every little thing that I found interesting, but that quickly became overwhelming to keep up with. Instead, I decided to compare Instagram likes to Twitter shares. My thinking is that if I like something on Instagram or share a piece of content on Twitter, then it was interesting to me.
This resulted in the ultimate small data, which I tasked the Data School with visualising as well. The premise of the activity is to give yourself 60 minutes to create as many different visualisations in Tableau as possible. I came up with 70, and I walk you through them in the story below.
This resulted in the ultimate small data, which I tasked the Data School with visualising as well. The premise of the activity is to give yourself 60 minutes to create as many different visualisations in Tableau as possible. I came up with 70, and I walk you through them in the story below.
Subscribe to:
Post Comments
(
Atom
)


No comments
Post a Comment