August 16, 2015
A 13 Year Old Takes on Tableau and Dear Data Two
This is a guest post from my 13 year old son Oscar, who, while we were on holiday in Scotland, saw me working on a postcard for Dear Data Two and asked if he could participate in the next week, which of course I thought was totally awesome! For week 18, the topic was drinks.
Every once and a while, my dad would show me his projects in Tableau. I found it very interesting with how it all worked. Recently, I’ve seen him working on this Dear Data Two project and found it cool with the brilliant idea to record and put certain data into a graph and present it in a tiny postcard.
On the way back home from Scotland, I asked my dad if I could do one of the projects with him. He told me that it was drinks for the week so I thought up of how I was going to record it. Over the next week, I record what day, time, and drink for the graph. The process was long but, it paid off. The data showed my most common drink and my least common drink.
The next day, I made three different graph drafts in my notebook to use as a base for the real deal. The first one was a pie chart, but my dad told me to either not use it, make it nicer, or make another.

I made another graph using bars to show the amount of drinks had on each day and another graph to show the amount had of each drink over the week.

Lastly, I made a graph to represent the amount of drinks over the course of the week in a line graph. I didn’t have enough room to put the graph on a single page, so, I split it up on two pages.


Later, my dad helped me make a Tableau account and downloaded it to my computer. I watch the tutorial video and followed along. It made sense after you get to know how everything works. The fun part, that I find, about Tableau is that there is a ton of combinations that you can make with only a few options given to you so that you can discover what happens.
I made the nice and presentable version of the graphs from my notebook in Tableau. Then I put them in a story and presented it to my dad.
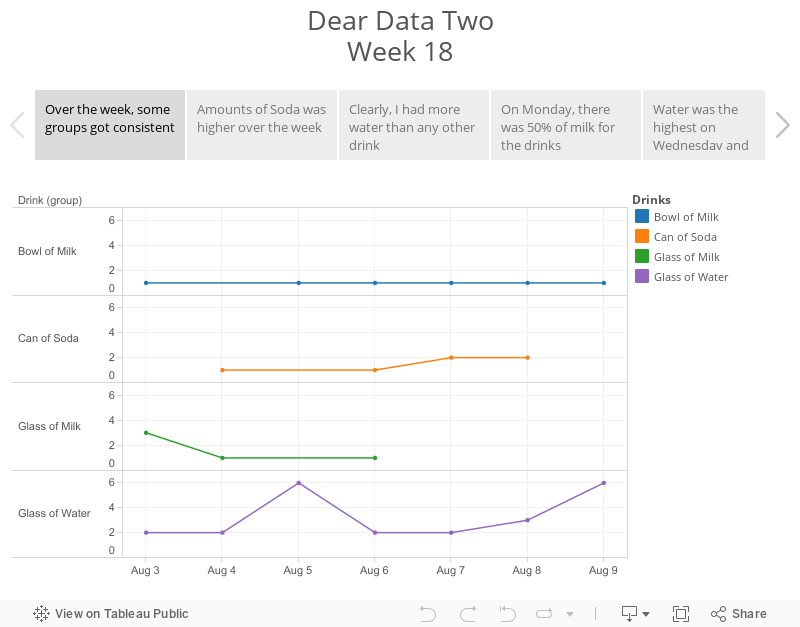
As you see, it shows my drinks for the week, put in the four biggest groups. I enjoyed creating the graph and story and I thank my dad for letting me have this experience.
I finished the project by creating the postcard to send to Mr. Shaffer.


I hope this post is inspiration to anyone that ever struggles with Tableau. Keep it simple and you'll do just fine.
Every once and a while, my dad would show me his projects in Tableau. I found it very interesting with how it all worked. Recently, I’ve seen him working on this Dear Data Two project and found it cool with the brilliant idea to record and put certain data into a graph and present it in a tiny postcard.
On the way back home from Scotland, I asked my dad if I could do one of the projects with him. He told me that it was drinks for the week so I thought up of how I was going to record it. Over the next week, I record what day, time, and drink for the graph. The process was long but, it paid off. The data showed my most common drink and my least common drink.
The next day, I made three different graph drafts in my notebook to use as a base for the real deal. The first one was a pie chart, but my dad told me to either not use it, make it nicer, or make another.
I made another graph using bars to show the amount of drinks had on each day and another graph to show the amount had of each drink over the week.
Lastly, I made a graph to represent the amount of drinks over the course of the week in a line graph. I didn’t have enough room to put the graph on a single page, so, I split it up on two pages.
Later, my dad helped me make a Tableau account and downloaded it to my computer. I watch the tutorial video and followed along. It made sense after you get to know how everything works. The fun part, that I find, about Tableau is that there is a ton of combinations that you can make with only a few options given to you so that you can discover what happens.
I made the nice and presentable version of the graphs from my notebook in Tableau. Then I put them in a story and presented it to my dad.
As you see, it shows my drinks for the week, put in the four biggest groups. I enjoyed creating the graph and story and I thank my dad for letting me have this experience.
I finished the project by creating the postcard to send to Mr. Shaffer.
Subscribe to:
Post Comments
(
Atom
)


No comments
Post a Comment