May 3, 2017
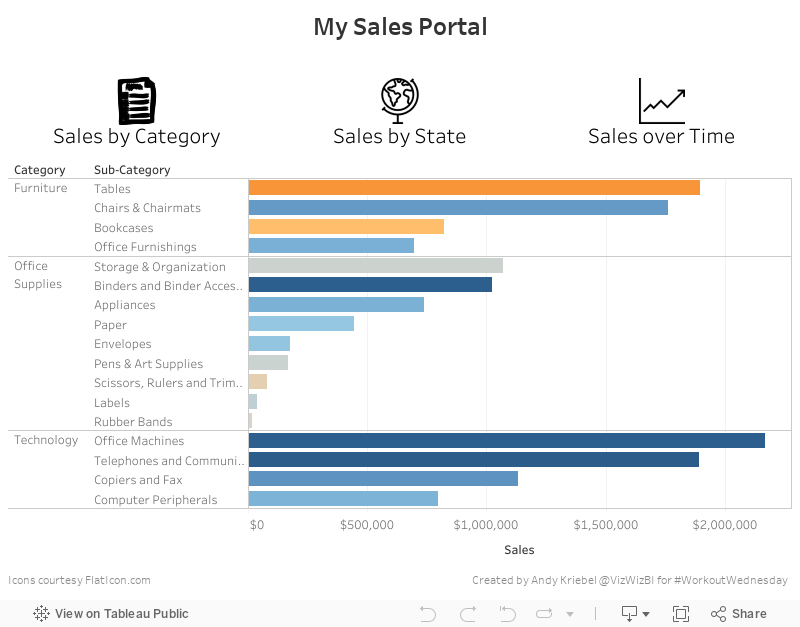
Workout Wednesday: Appearing & Disappearing Charts
action
,
bar chart
,
Emma Whyte
,
exclude
,
filter
,
hide
,
icon
,
line chart
,
map
,
show
,
Workout Wednesday
3 comments
You can find the requirements over on Emma's blog. Here's my solution as a GIF:
The showing/hiding of the charts was pretty straightforward. My data doesn't match Emma's exactly despite using the same data source. I think maybe there's a join or data source filter on hers, but that's not really the point of this exercise. I also used different icons because I couldn't find the ones she used.
I won't give any hints as to how I did this so that you can do it on your own. I implemented this trick differently than Emma and both of our workbooks are downloadable if you care to have a look after you give it a try. Here's my Tableau dashboard.
Subscribe to:
Post Comments
(
Atom
)


Took your workbook as a template for the icons/viz's b/c well I'm lazy...then used a method I picked up awhile back for fixing the double click of icons after one has been selected. This is a better user interaction to just flip through the icons without having to unselect.
ReplyDeletehttps://public.tableau.com/views/WoW18/Cat?%3Aembed=y&%3Atabs=no&%3AshowVizHome=no#3
Hi Andy, I don't know how to build such a viz. Would you have any reading to recommend so that I learn how to do it ?
ReplyDeleteTry to reverse engineer it. That’ll help you learn more than reading about it.
Delete