January 11, 2021
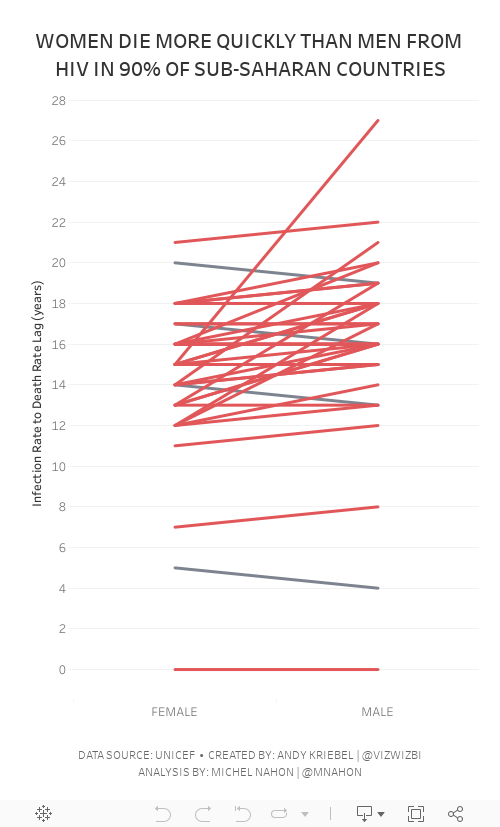
#MakeoverMonday Week 2 - Women Die More Quickly Than Men From HIV Infection

I must admit that I REALLY struggled with this data set. I could have easily just compared males vs. females by country and year, but it seems we've been doing that over and over again. I looked to explore the data and thought a connected scatterplot would look nice, but it didn't.
Fortunately Michel Mahon proposed looking at the lag between the year of HIV infection rate and death. Morbid yet interesting analysis. It took me a while to get the calcs working; I'd recommend you build your view as a table to verify the calcs when you're not sure if they're correct. In the end, thanks to Michel's suggestion, I created a slope graph that compares the lag in years for both men and women.
As the documentation suggested, women die more quickly than men.
Below are both my visualization and the Watch Me Viz session on YouTube. Thanks for tuning in!
July 14, 2019
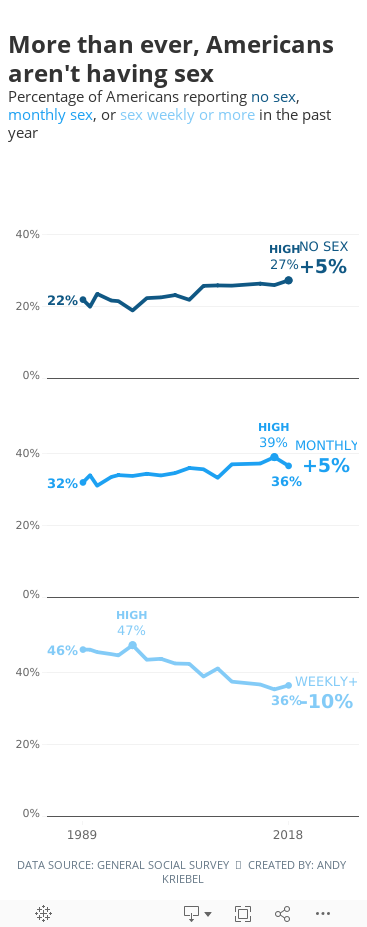
#MakeoverMonday: More than ever, Americans aren't having sex


What works well?
- Overall, the chart is really good.
- The title and subtitle make it very clear what the viz is about.
- The labels focus you to the topic the creator wants you to focus on.
- I like how the first year is a filled dot and the last year is an open dot.
- Bolding the first and last years on the axis
- Including the % sign on the y-axis for only the top value
- Is this colorblind friendly? I'd recommend verifying.
- Does green mean good?
- I don't know how they came up with the percentages they did. They don't match the source.
- Label the lines directly with their frequency instead of using a color legend.
- Lighten the gridlines.
- Like the original, I filtered out 2012 because the data looks corrupted.
- I liked the original, so I didn't change a whole lot. The main difference was splitting up the frequencies vertically.
- Because I split of the frequencies, I made the viz tall and skinny and mobile friendly.
- I labeled the start and end of each line.
- I labeled the highest value for each frequency.
- I included the change between 1989-2018 on the end of each line as a summary. I had to float everything to make this work, which damaged my soul a bit.
- I'm only displaying the first and last year on the y-axis.
- I included tooltips so the reader can see the exact values.
- I used three shades of a single color that go from least sex to most sex (since the focus is on less sex).
- I kept the same title and subtitle.
- I used fonts from the Washington Post website. NOTE: They won't render on Tableau Public unless you have the same fonts installed (Playfair Display and Yantramanav).
March 13, 2017
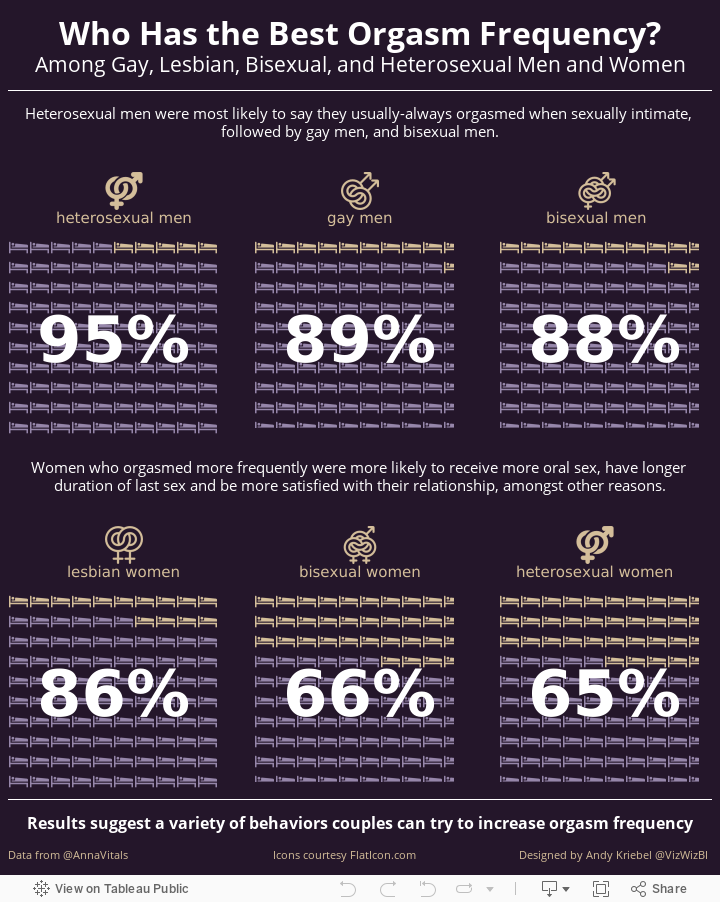
Makeover Monday: Who Has the Best Orgasm Frequency?
Let's take a quick look at the original viz by Anna Vital, an information designer based in San Francisco.
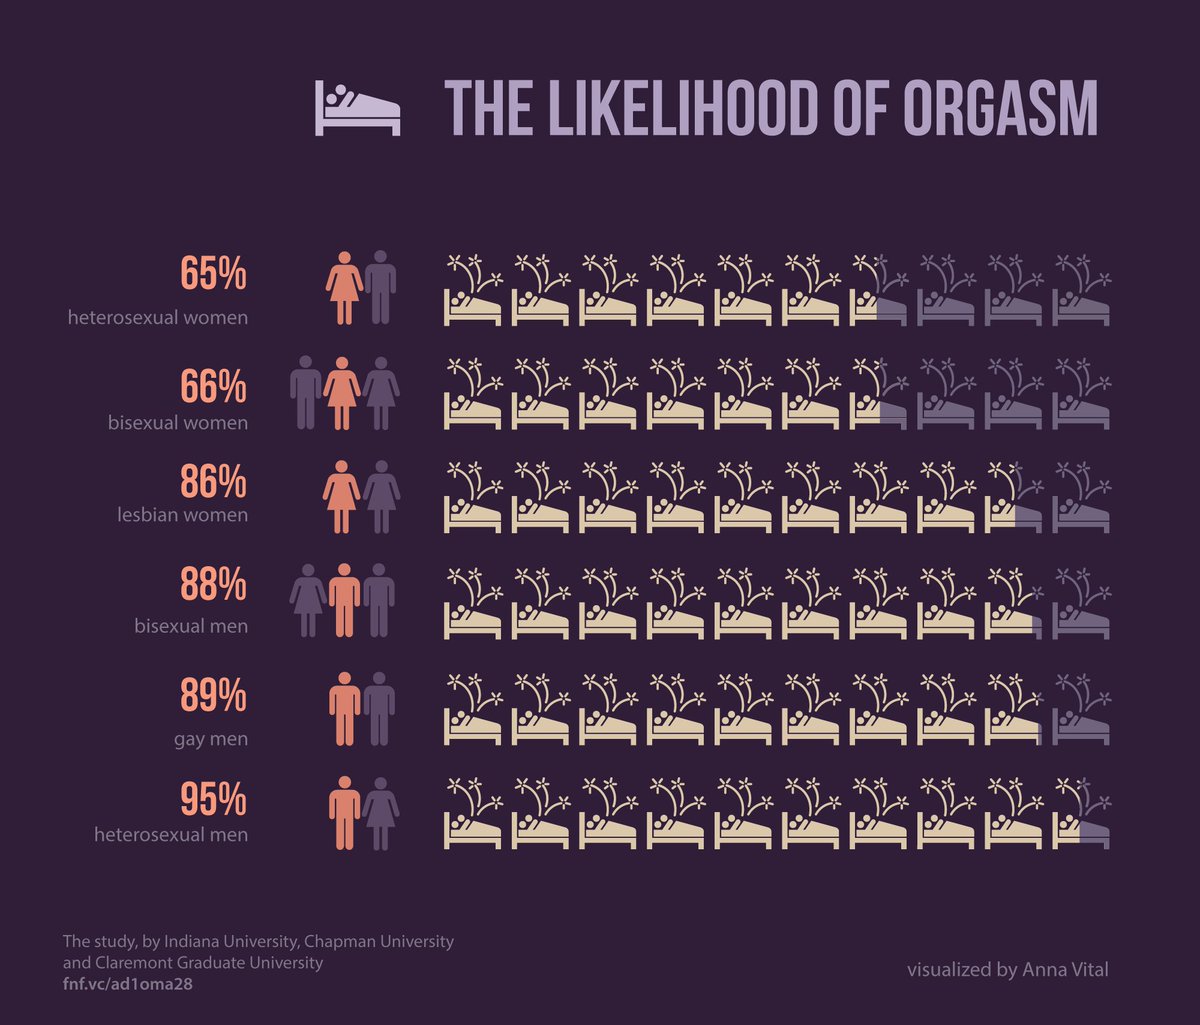
- Orange text on the dark purple background
- Title captures your attention
- Using icons for the relationship type
- Nice big numbers
- Bed icon that looks like it has shooting stars coming out of it
- Metrics are sorted
- Including references to the data source
- Simple, organized layout
- Bed icons are partially shaded, which makes it tough to know the exact amount each bed is shaded. However, including the large numbers helps offset this weakness.
- Light purple is really hard to read
- Could use a better title; this one captures our attention because it's about sex
- Should the icons that are shaded as out of the range still have the fireworks coming out of them?
- Sorting from worst to best; I would sort the other way around to emphasize the positive
October 27, 2010
National Survey of Sexual Health and Behavior

Note that I concatenated Sex & Behavior to determine which acts are the most frequent and by whom. I chose a red-blue pallet since our sexual activity goes hot and cold. Displaying the data in the manner, I was able to quickly identify that:
- Men masturbate their whole lives
- The age ranges from 20-39 are clearly the peak sexual activity periods, with 25-29 standing out the most
- There is very little woman on woman and man on man oral sex
- We run out of steam in our 70s
Download the workbook from Tableau Public here.






