July 19, 2017
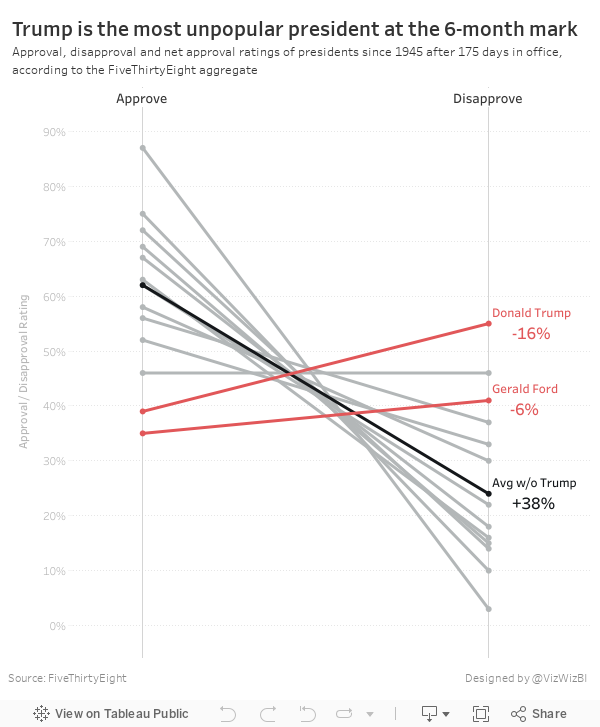
Trump is Historically Unpopular
approval ratings
,
Donald Trump
,
fivethirtyeight
,
Harry Enten
,
highlight
,
makeover
,
President
,
slope graph
3 comments

The table is ok in that it lists the presidents in descending order by net approval rating. However, I thought a visual display would be more effective. I used Google Sheets to import the table and quickly connected it to Tableau and built a slope graph to more effectively display the data.
It only took about 15 minutes to build this, so I'm surprised FiveThirtyEight didn't include a visual. I wonder what their reasoning is for including a chart vs. a table. What do you think? Which view works better for you?
Subscribe to:
Post Comments
(
Atom
)


I am a fan of visuals, so thanks for whipping this cool example together. I will also say that an increasing slope that's actually communicating a decline over time was a bit tricky to read. Maybe another form would be better or five thirty eight could've kept it to approval rating at inauguration and 6 months later so the slope can compare apples to apples?
ReplyDeleteFair point. I put disapprove before approve and it looked a bit weird. Maybe a simple bar chart of the net approval rating would be even better.
Delete
DeleteI like the bar chart idea.
Maybe put approve/disapprove for each president next to each other and put the net approval above in a visually striking way (like you've done here)? With the actual approve and disapprove numbers inside wach bar, at the bottom or in the middle, in muted colors and smaller font.