Showing posts with label alcohol consumption. Show all posts
June 23, 2019
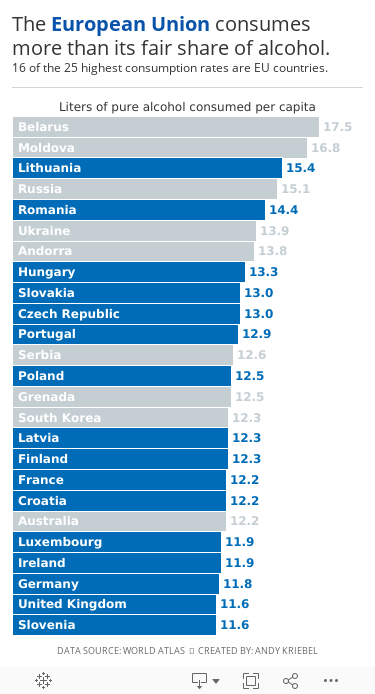
#MakeoverMonday: The European Union consumes more than its fair share of alcohol

 |
| Source: World Atlas |
What works well?
- Clear title
- Countries are listed in decsending order
- Simple color for the bar chart
- Labeling the axis
What could be improved?
- The axis is truncated; this is a big no-no for a bar chart.
- The labels for the countries don't need to be rotated on a diagonal.
What I did
- A bar chart is the easiest way to communicate, so I've kept that.
- I rotated the bars to make them horizontal.
- I save space by labeling the inside of the bars with the country name.
- I labeled the ends of the bars so that I wouldn't need an axis.
- I highlighted the EU countries, since I found that an interesting piece of the analysis.
- I created the viz as a mobile size, since I thought this was as good of an opportunity as any to practice mobile design.
Thoughts?
April 1, 2018
Makeover Monday: World Wine Production
alcohol consumption
,
change
,
difference
,
highlight
,
line chart
,
Makeover Monday
,
parameter
,
wine
6 comments

What works well?
- It's a simple line chart, which makes it easy to understand.
- The red line stands out well against the white background without being too bright.
- The units on the axis are labeled.
- The title tells is what the line represents.
What could be improved?
- The subtitle could be moved to a caption below the image.
- The axis has a strange scale. Why does it start at 180?
- Adding the drop lines makes it look like the length of those lines is important, but if you compare the length of the lines, then that could be misleading due to the axis starting at 180. I'd remove those lines.
- The year labels are diagonal.
- Each year doesn't need a label.
- Why doesn't the source document contain data for all of the years?
My Goals
- It's Easter and I have basically no time to work on this, so do something quick.
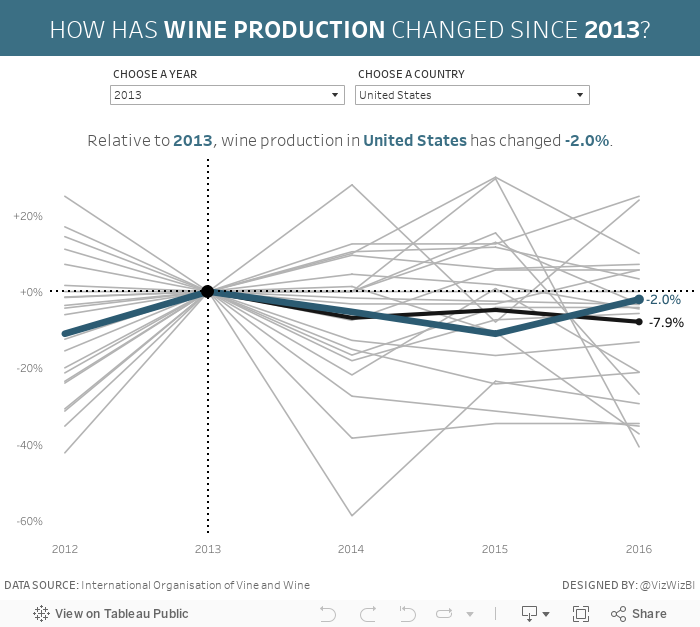
- Mimic what we created for Workout Wednesday week 33.
- Focus on the relative change from a chosen period instead of the absolute change. For me, this is more meaningful if you want to see how much a country has changed and it normalizes all of the countries.
That's it. All done!
March 11, 2018
Makeover Monday: The Twisted Nature of Irish Whiskey Sales
alcohol consumption
,
BordBia
,
Glendalough
,
Information Lab
,
ireland
,
irish
,
Makeover Monday
,
St. Patrick's Day
,
The IWSR
,
whiskey
,
whisky
4 comments

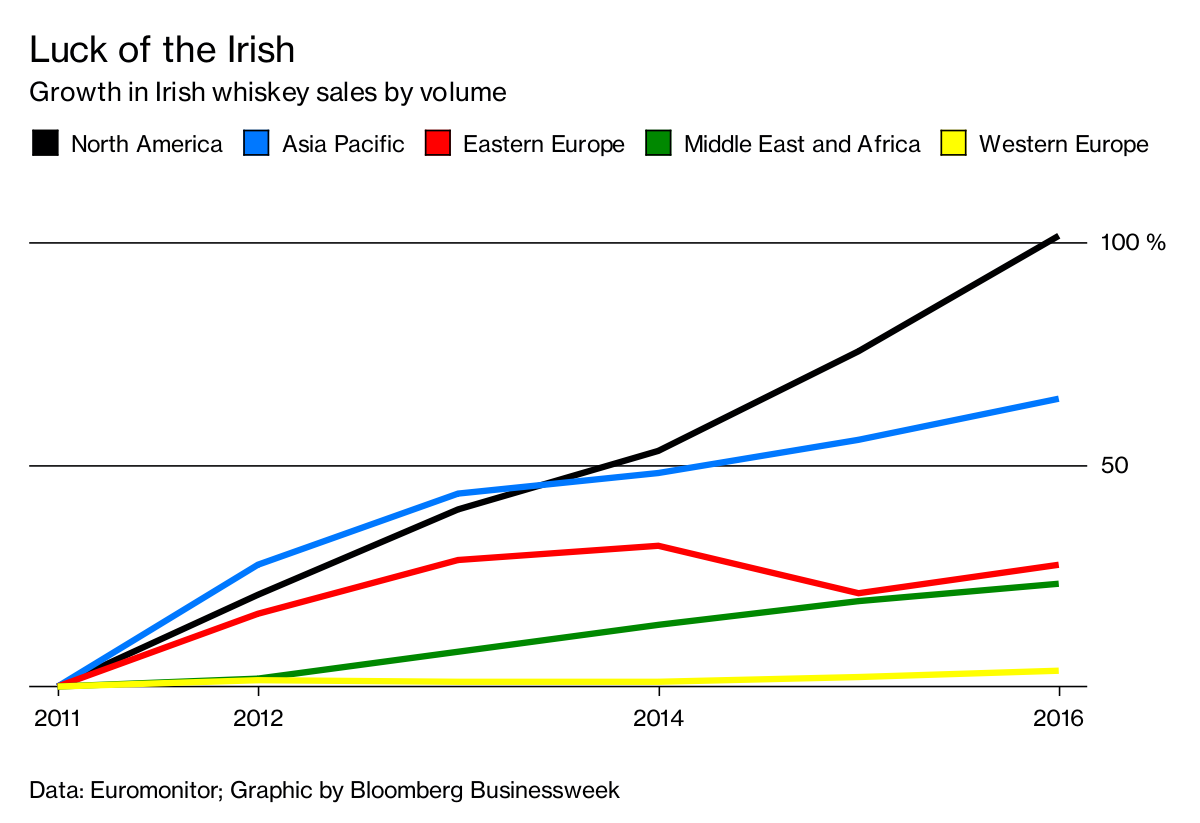
Also, thank you to BordBia for providing the data that they collected from The IWSR. Let's have a look at the visualization to makeover from Bloomberg Businessweek:
What works well?
- Overall the design is clean, including minimal gridlines.
- Showing cumulative growth since 2011 makes it easy to compare the regions.
- The region colors are easy to distinguish from one another.
- The subtitle tells me what the chart is about.
- The legend is prominently placed so that we know it's important.
- Putting the axis on the right speed processing because the axis is next to the end of the lines.
What could be improved?
- Labeling the lines directly would remove the need for the legend.
- Labeling the ends of the lines would tell us what the growth actually has been.
- The title isn't very relevant to the data. Why does this make the Irish lucky? A better title is needed.
- So what? What are we supposed to get from this?
My Goals
- There are a lot of countries and a lot more years in the data set, explore them and look for stories.
- Consider the regional aggregations to see if there's an significance.
- Look at both volume and change. Looking at just change doesn't factor in the volume that each country imports.
- This is time series data, so spend time looking at line charts.
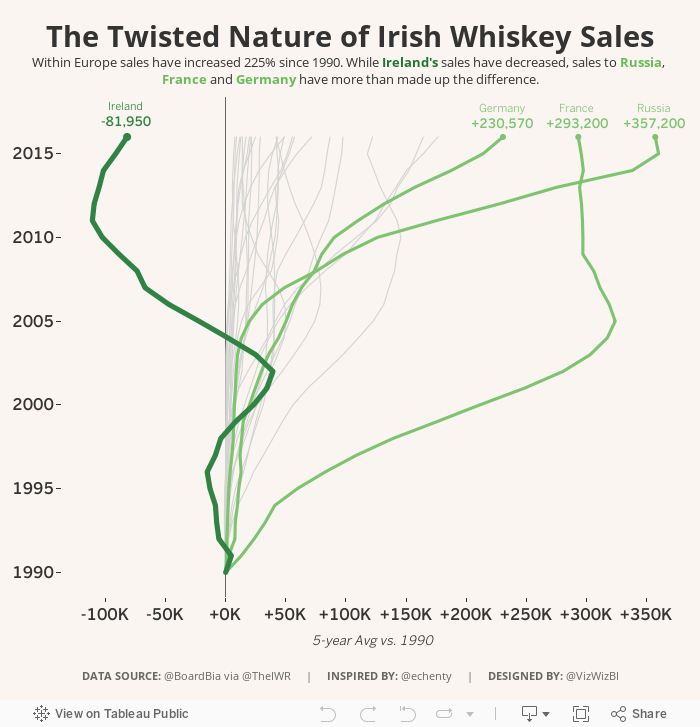
After playing with data for a while, I remembered this great viz by Emily Chen and thought it might fit well with this data set because whiskey sales within Ireland have decreased. I used her viz as my style guide to create my Makeover Monday week 11.
May 21, 2017
Makeover Monday: How has alcohol consumption in Britain changed since 2005?
A couple weeks ago, BBC Health published this simple viz about the change in drinking habits in the UK between 2015 and 2016.
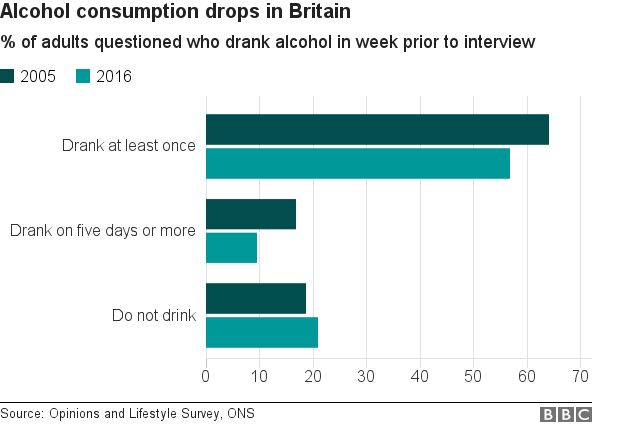
What works well?
- Simple title that tells me what the viz is about
- Subtitle that provides context for the numbers
- Side-by-side bars are a good way of comparing values year-over-year
- Overall clean layout
- Nice fat bars to make comparisons easier
- Colors are distinct enough
What could be improved?
- Include a % symbol on the axis somewhere
- This is a very narrow view of the data, whereas there are many more years available and it's also available by gender.
- It's a pretty boring viz; one that you'll often skim by and not engaged with.
- Label the bars
For my viz, I knew I wanted to use male, female and all people plus all years. This removes a bar chart as an option, preferring lines to show the trends since 2005. In addition, I wanted to show change since 2005 to provide better context that matches the purpose of the title.
I drew inspiration from this European IronViz entry by Ravi Mistry. I like how he is showing the change since the beginning.

Unlike Ravi, though, I decide to only label the line for all persons. I made this decision because labeling the end of each line would have made the viz feel crowded, as the numbers are varying enough to provide room to breathe.
I wanted to test out the Inconsolata font that Nathan Yau uses for his charts over on Flowing Data. If you have it installed on your computer, you'll see my intended display. If not, Tableau Public will server up something, not sure what really.
I wanted to test out the Inconsolata font that Nathan Yau uses for his charts over on Flowing Data. If you have it installed on your computer, you'll see my intended display. If not, Tableau Public will server up something, not sure what really.
Lastly, the colors. I picked them from the ONS dashboard about the UK economy.
Click on the image below for the interactive version.
October 21, 2016
Fix It Friday: Ten Alternatives Methods for Presenting Alcohol Consumption in OECD Countries
alcohol consumption
,
arrows
,
bar chart
,
barbell chart
,
chart junk
,
Fix it Friday
,
gantt
,
makeover
,
map
,
OECD
,
Paul Kirby
,
trellis chart
12 comments

Interesting @OECD chart on alcohol consumption. By country & trend. E.g Austrians drink twice as much as Italians pic.twitter.com/OOGYJ3BpAq— Paul Kirby (@paul1kirby) October 19, 2016
You might think "It's just a chart Andy, relax!" True. It's a chart. It's not changing the world or anything. There are several things that have me a bit upset:
- Paul Kirby calls the chart "interesting" and maybe the CONTENT is interesting, but the chart is terrible.
- He says "Austrians drink twice as much as Italians", a fact that is simply not true. They drink 61% more than Italians. You can't just spout facts like that.
- Paul is visiting professor at the London School of Economics. I can only assume that his students follow him on Twitter. When he tweets things like this, his student will assume that this is how charts should be made, which only proliferates the number of poor charts we'll continue to see.
The chart itself has its own set of problems:
- It's too dark overall. The dark red bars and dark bottles are hard to see against the blue background.
- The flags are unnecessary. What value do they add?
- The bottles are cute, but unnecessary decoration.
- The legend is in reverse order.
- Do the bottle extend beyond the bars or do they start from the same baseline?
- It has a weak title. What's the story?
This is chart junk at its best. Don't create charts like this. I went to the OECD website and downloaded the data. Below I present ten alternative charts that all work better than the original. You can download the Tableau workbook with all of these charts here.


Subscribe to:
Posts
(
Atom
)