November 23, 2020
#MakeoverMonday: America Needs to Pay Its Bills

Today's Makeover Monday marked my 1,000th viz published to Tableau Public. I must say that I'm pretty proud of myself. This feels like a pretty big milestone in my career. I wonder how many hours I've spent using Tableau in my life.
Thank you for all of your support and encouragement along the way. Tableau wouldn't be anything without the Community.
Let's get to week 47. The visualization comes from Visual Capitalist.

- The bar/line combination charts work well since they are on the same scale. This also makes them easier to distinguish.
- Choosing colors that match the American flag (I'm assuming that was intentional)
- Making 2020 a slightly different shade of red
- Title is clear
- Text callouts add useful context
- Big numbers to show the most recent values
- The 2020 bars are at the quarterly level, but the remaining bars are by year. Is it the end of the year? The start of the year? That could easily lead to confusion. Keep it as a consistent time scale.
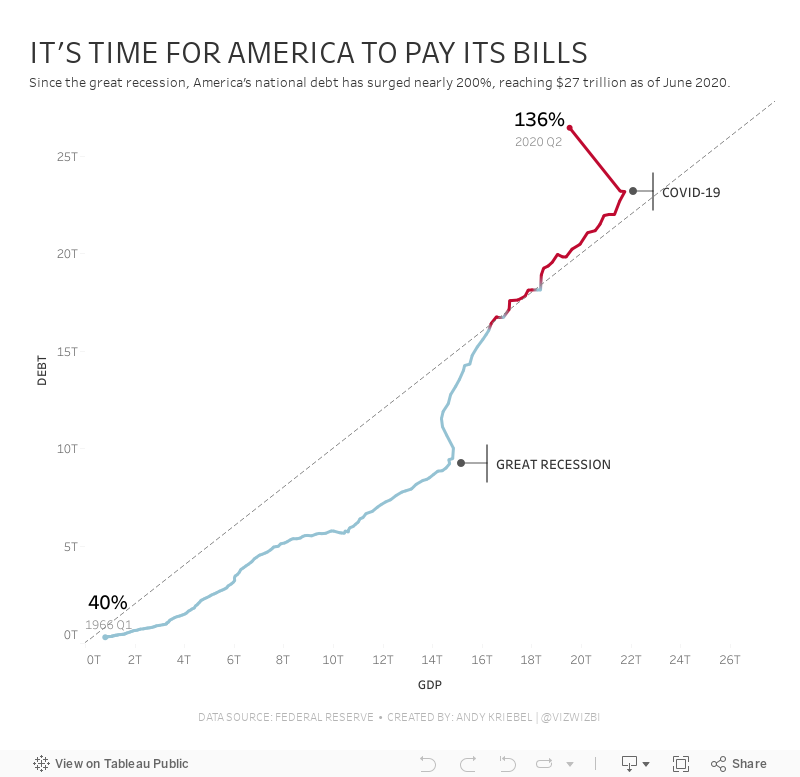
- Compare debt to GDP
- Show the debt to GDP ratio
- Show when the debt to GDP ratio exceeded 100%
- Highlight important milestones that led to the largest increases
July 11, 2016
Makeover Monday: What Lawmakers Spoke About After the Orlando Mass Shooting

This week’s Makeover Monday is a bit of a dark topic that gives us a glimmer into the how politicians in the US respond to a tragedy. Yes, this is a single mass shooting, but they occur nearly every day in America and the responses from politicians are now all too standard. The Orlando mass shooting likely got more attention because it happened at a LGBT club. This and other tragedies beg the question: When will America get its act together?
The chart that we’re reviewing this week is by the grapics team at The Washington Post.

What works well?
- It’s neatly organised in a 3x3 grid.
- The semi-circles are all sized relative to each other.
- It’s very easy to understand.
- They used colors that are automatically associated with the two political parties
- Everything is clearly labeled.
- It’s not over-cluttered.
What could be improved?
- The chart implies that there are equal representatives in both parties. However, Republicans have 247 seats while Democrats have 187.
- Using semi-circles makes the shapes hard to compare.
- It's difficult to compare across the topics.
- There should be an easier way to which party talks more about each topic
Given these changes I would like to see, I’ve create this version that shows how many representatives talked about each topic in a tornado chart format. I then included a circle with a number inside to show which party talked about the topic more and by how many representatives. Lastly, I added lots of summary details in the tooltips.
May 31, 2011
How to see a tornado at the Subway Series
On May 23, Sports Chart of the Day published this chart comparing wins and runs scored in the Subway Series (i.e., Yankees vs. Mets).

There are some fundamental problems with this chart:
- The stacked bars are irrelevant and misleading. Wins and runs scored are two very distinct stats and adding them together makes no sense whatsoever.
- Are these stacked bars or overlaid bars?
- The years are sorted in reverse order. This makes it much more difficult to see trends because you have to get your brain to think backwards in time
- The labels create too much chart junk
- The dark gray background…why do so many of their charts have this background? I don’t get it.
I recreated the data in Excel and threw it into Tableau and came up with three simple alternatives: a tornado chart, a line chart and a bullet chart. Which on is your favorite? What can you do with the data? Download the workbook and leave a comment with a link to your viz.



