August 24, 2018
Makeover Monday: Africa's Deadliest Armed Conflicts - Density Map vs. Heat Maps


The workflow is simple and I'm sure there's a more elegant want to create it. The guts of the workflow:
- Create spatial points from the latitude and longitude of each record.
- Convert the spatial points into a heat map by grouping the points into grids.
- Union the four streams back together.
- Export the data as a shapefile.
The reason I have four streams in the workflow is because I didn't see a way of doing a grouping by the event type within the heatmap tool.
The Alteryx heatmaps are easy to adjust; I played with the grid size and maximum distance a few times until I got something close to Tableau's density maps (without fiddling with the settings endlessly). I settled on a grid of 33 miles and a max size of 75 miles.
I also chose to create the shapes as donuts so that they wouldn't stack on top of each other. Here's the result:
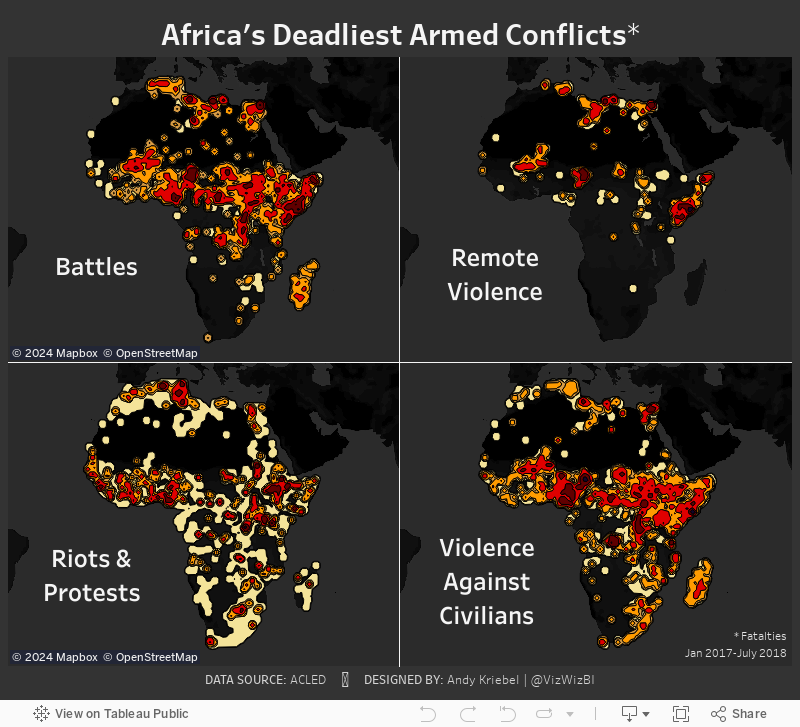
Density Maps vs. Heat Maps

Here are some of the differences I have noted:
- Density maps in Tableau are completely dependent upon the number of marks in the view. The more accurate you want the density, the more marks you need to include. That's 9229 marks in this case.
- Since the heat maps Alteryx generates are shapefiles, they will render much faster as there are only 28 marks.
- The Alteryx heat maps clearly encompass all points, meaning you can see EVERYWHERE that there was an incident.
- Tableau's density maps hide the outliers.
- You can't have highlight actions on a density map as there no dimension categorizing the heat.
- The density maps looks much cleaner than the heat maps.
August 19, 2018
Makeover Monday: Africa's Deadliest Armed Conflicts

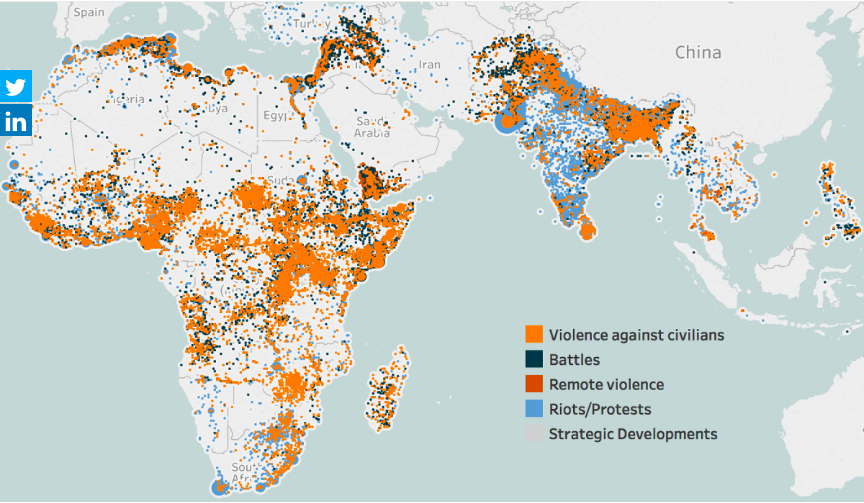
What works well?
- The map is zoomed into the areas that are the focus of the data.
- The color palette has enough variation to distinguish between the type of violence.
- Putting every incident on the map helps show the volume of conflicts.
What could be improved?
- Because the dots are overlapping and there's no transparency, you can't see what is behind each dot. Are there battles behind the violence against citizens? I have no idea from this chart.
- Some of the dots look like they are sized differently. Why?
- There's no title.
- The data source isn't referenced.
- While the color palette give a good range, I'm not sold on the color choices. These are all bad topics, but the blue could come across as not bad.
- Have fatalities been accounted for?
What I did
- I like the idea of a map for this data set, but I think a density map will work much better. As this is now only in beta, I can only post an image. I'll post the interactive version once Tableau 10.3 comes out.
- I wanted to understand where the deadliest conflicts occur, so I create a metric for fatalities per incident.
- The density is colored by this metric.
- I separated out the types of violence to address the issue of overlapping.
August 28, 2017
Makeover Monday: Player Arrests in the NFL since 2000

Let's have a quick look at the original viz.

What works well?
- Really nice interactivity
- Fast and slick filtering options
- Sorting the teams from worst to best
- Allowing the user to customize the view
- Showing the top 5 in three categories
- Expand button allows you to quickly see a bigger chart
- Option to click on a team and quickly drill into that team
What could be improved?
- The Hide All and Show All buttons are unnecessary.
- Too many colors
- Tooltips aren't very useful
- Comparisons are more difficult than they need to be
My Goals
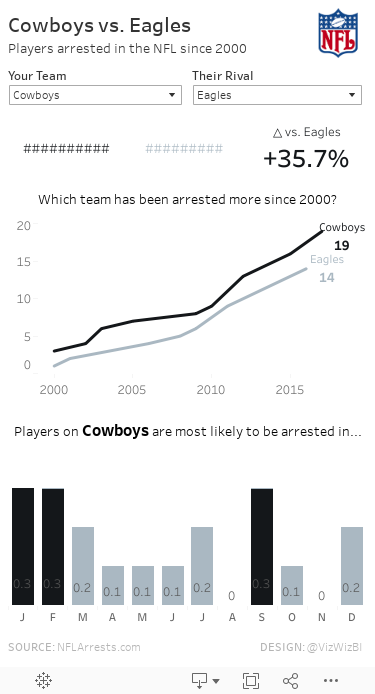
- Allow for comparisons between teams
- Make the patterns more obvious
- Reduce the complexity of the view
- Choose simple chart types
- Show BANs to summarize the data
- Make a mobile-friendly view
July 11, 2016
Makeover Monday: What Lawmakers Spoke About After the Orlando Mass Shooting

This week’s Makeover Monday is a bit of a dark topic that gives us a glimmer into the how politicians in the US respond to a tragedy. Yes, this is a single mass shooting, but they occur nearly every day in America and the responses from politicians are now all too standard. The Orlando mass shooting likely got more attention because it happened at a LGBT club. This and other tragedies beg the question: When will America get its act together?
The chart that we’re reviewing this week is by the grapics team at The Washington Post.

What works well?
- It’s neatly organised in a 3x3 grid.
- The semi-circles are all sized relative to each other.
- It’s very easy to understand.
- They used colors that are automatically associated with the two political parties
- Everything is clearly labeled.
- It’s not over-cluttered.
What could be improved?
- The chart implies that there are equal representatives in both parties. However, Republicans have 247 seats while Democrats have 187.
- Using semi-circles makes the shapes hard to compare.
- It's difficult to compare across the topics.
- There should be an easier way to which party talks more about each topic
Given these changes I would like to see, I’ve create this version that shows how many representatives talked about each topic in a tornado chart format. I then included a circle with a number inside to show which party talked about the topic more and by how many representatives. Lastly, I added lots of summary details in the tooltips.
December 14, 2012
A map that says it all - States with stricter gun control laws have fewer deaths from gun-related violence
From the Washington Post. Enough said. Let the political posturing begin.

April 28, 2011
US peace index: how does each state compare?
Via the Guardian Datablog, questions to ponder:
- Which is the most violent state?
- Which are getting better/worse?
Click on a state either in the map or the bar chart to update the trend. Filter to the years you want to see with the table on the lower-left.
It’s pretty clear that the peace index is worst in the south. I wonder if there is any correlation to gun control laws?






