September 11, 2017
Makeover Monday: Stolen Bikes in the UK
bicycles
,
crime
,
cycling
,
Makeover Monday
,
theft
,
UK
,
united kingdom
2 comments
For this week's makeover, we're looking at the page where you can search a specific postcode. Given I ride to work, I naturally entered our work postcode and got this visualisation.

What works well?
- The search feature and map are very engaging. I wanted to zoom all the way in to work.
- The result set is within a mile of the postcode I entered, providing context and relevancy.
- The map is easy to use. Click on a marker and you get a bit of information about the incident.
- Using a map shows the volume of stolen bikes well.
- The table and tabs provide a simple way for me to lookup information.
What could be improved?
- Clicking on one of the numbers on the map doesn't then drill into each of those incidents.
- The Last 6 Months tab doesn't show trends well.
- The Worst Locations tab isn't very useful if you not very knowledgable about the area.
- All of the tables would be more impactful as charts.
Questions I want to answer
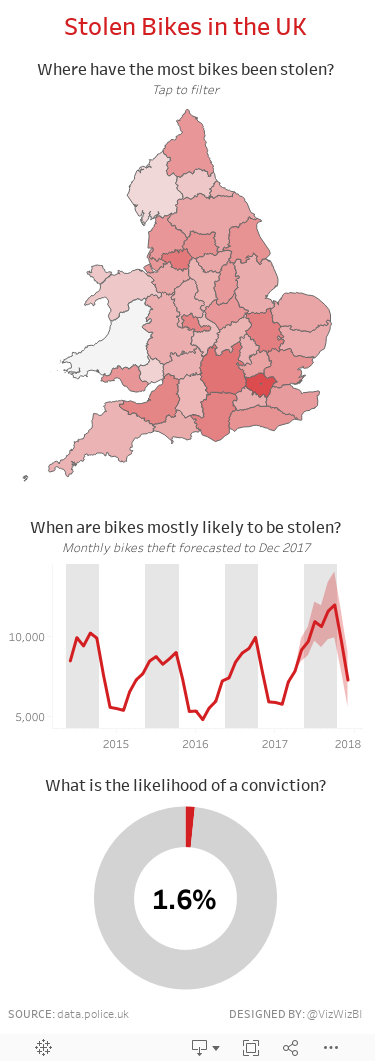
- What are the worst areas in the UK?
- Is bike theft increasing or decreasing overall and in specific areas?
- Are there as few positive outcomes as it seems?
- Where should I avoid locking up my bike?
- Is there any seasonality in the data? My hypothesis is that the number of bikes stolen would reduce in the winter months.
To answer the first question, I downloaded the police force boundaries from data.police.uk and merged all of the KML files together with Alteryx and output the result as a single shapefile.

From there, I blended the shapefiles with the bike theft data to create a map showing the log scale of bike thefts by police force. I chose a log scale because London is a crazy outlier.
With the questions in mind above, here's my Makeover Monday week 37 which I've optimized for mobile consumption.
Subscribe to:
Post Comments
(
Atom
)


Hi Andy,
ReplyDeleteI have to admit that I'm not very fond of your map. I think you aren't visualising 'the worst areas in the UK' as you initially intended. It's quite obvious that London will have more cases of bike theft than Cumbria, because the population is bigger, but that doesn't mean that London is more dangerous than Cumbria. That could be solved if you used some sort of ratio, for example bike thefts per 10,000 people.
-Duarte
Fair point and definitely something I should have accounted for.
Delete