October 29, 2015
Dear Data Two - The Presentation & Video
Data15
,
Dear Data Two
,
presentation
,
video

Presenting with Jeffrey was an absolute joy! I’d present with him again any time.
Enjoy!
October 21, 2015
Makeover: The Billion Dollar Startup Club
Today at the Tableau Conference keynote, Dave Story introduced the crowd to Vizable, the first time Tableau has launched a new product at its conference. I immediately downloaded it and have already built three simple charts that took no more than a few minutes each.
As a use case, let’s look at this viz from The Wall Street Journal.

This is cute, but completely ineffective as a design. Comparisons are nearly impossible. I copied the data from the webpage, saved it into Excel in OneDrive, opened Vizable, connected to the data, and built this simpler bar chart alternative, all in about 2 minutes.

Tableau has yet again gotten me addicted...quickly. I can see many great uses for Vizable already. Go download it and play. It’s completely free.
As a use case, let’s look at this viz from The Wall Street Journal.

This is cute, but completely ineffective as a design. Comparisons are nearly impossible. I copied the data from the webpage, saved it into Excel in OneDrive, opened Vizable, connected to the data, and built this simpler bar chart alternative, all in about 2 minutes.
October 14, 2015
Recommended Sessions for the Tableau Conference
As I sit in the Virgin lounge at Heathrow airport, I thought I’d quickly share my recommended sessions for the Tableau Conference. If this is your first Tableau Conference, you’re in for quite a treat. It’ll be an amazing experience and it will feel overwhelming. With a little planning you’ll be fine.
My best advice:
Here are the sessions I plan to attend. Note, the #RunData15 events are early on Tues/Thurs and we’ll leave from the MGM lobby promptly at 5:15am.


My best advice:
- Choose at least 2 sessions per time slot (in case you don’t get in your first choice)
- If a session sucks, get up, walk out and go to another session. Don’t worry about hurting the speaker’s feelings. They’re the reason you’re leaving in the first place. After all, you paid to be there, so you need to get the most out of it.
- All sessions that are led by Tableau employees are recorded, so if there’s a conflict, that could help you decide which one to skip.
- Absolutely DO NOT MISS the IronViz! It’s far and away my favorite session.
- Get to sessions early so you can get a seat, then go out and get a drink and use the facilities.
- Drink lots of water. These will be long, exhausting days (and nights) and the last thing you need is to be dehydrated in the desert.
- Meet as many people as you can. Find the people you follow on Twitter and say hi to them. I love it when I meet new people.
Here are the sessions I plan to attend. Note, the #RunData15 events are early on Tues/Thurs and we’ll leave from the MGM lobby promptly at 5:15am.
October 12, 2015
Makeover Monday: State of Connectivity 2014
bar chart
,
connectivity
,
country
,
facebook
,
internet
,
internet.org
,
InterWorks
,
Makeover Monday
,
map
,
Robert Rouse
,
slope graph
3 comments


I guess what bothers me most is that this simple bar chart is completely unreadable. I can’t find any countries unless I use a microscope. I assume this was by design, but I don’t see the value in it.
Of course the data was not provided, so I did a quick Google search and found the data in Wikipedia. I then used the InterWorks Web Data Connector for import.io to extract the data. I blended that with another data set I had of country abbreviations.
I started by recreating the original in Tableau.
Ok, I still can’t read it, but I can hover over a bar at least. I wanted something better, something easier to understand, something people might want to quickly explore. I created this three chart layout which includes a map, bar chart (same as the original, but larger), and a slope graph.
I’m not totally sold that this is complete or great, but it’s definitely better than the original. And remember, I timebox myself on these makeovers, so once I reach my time limit I stop. Rules are rules.
October 11, 2015
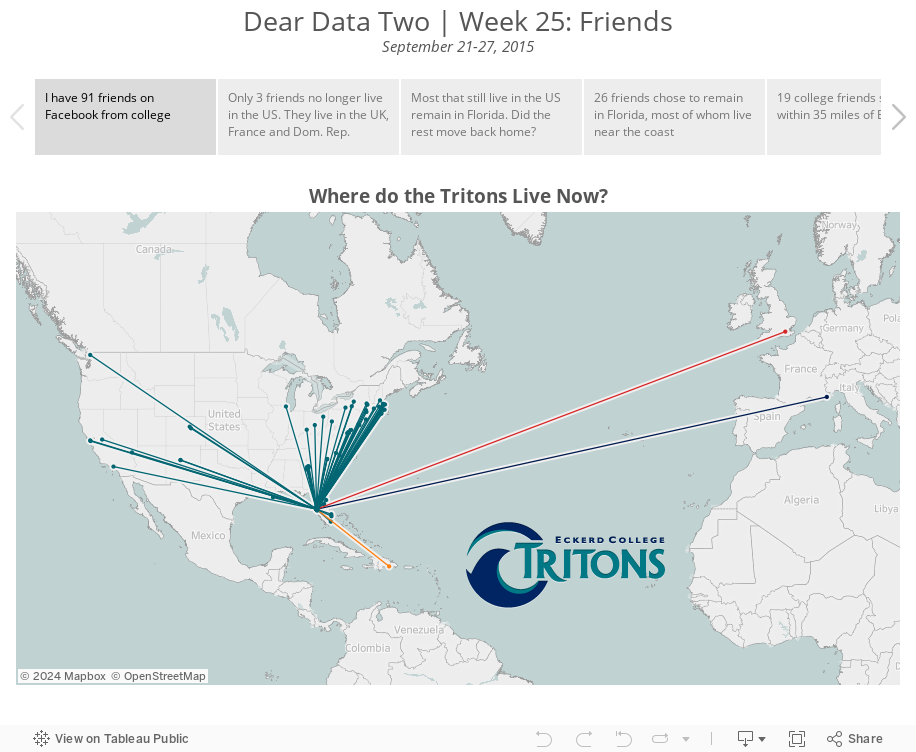
Dear Data Two | Week 25: Friends
Dear Data Two
,
distance
,
Eckerd College
,
friends
,
lines
,
map

I had a good idea in mind for what I wanted to do and I started by looking at all of my Facebook friends, the idea being that I wanted to create a map of where they all live. Unfortunately Facebook does not make it easy to get this information. The data preparation was going to take way too long, so I opted for looking at where my college friends Facebook live.
I entered all of their names and current locations in a spreadsheet and then added a second row for each person that was the location of our college, the awesome Eckerd College in St. Petersburg, Florida. Don’t look at pictures of my college; you’ll get way too jealous.
I then took all of the locations and ran them through batch geocoder to generate lat/long values for each person. This allowed me to calculate the distance each friend has moved away since college. Duplicating the rows also allowed me to create lines connecting Eckerd College to each person.
For the postcard, there’s no way I could have drawn a dot for every person, so I aggregated some locations together and used size to represent each person or group of people. I intended to use shapes as well, as you can see on the front of the postcard, but I forgot once I got into drawing the card. Chalk another victory up for the design medium.
October 6, 2015
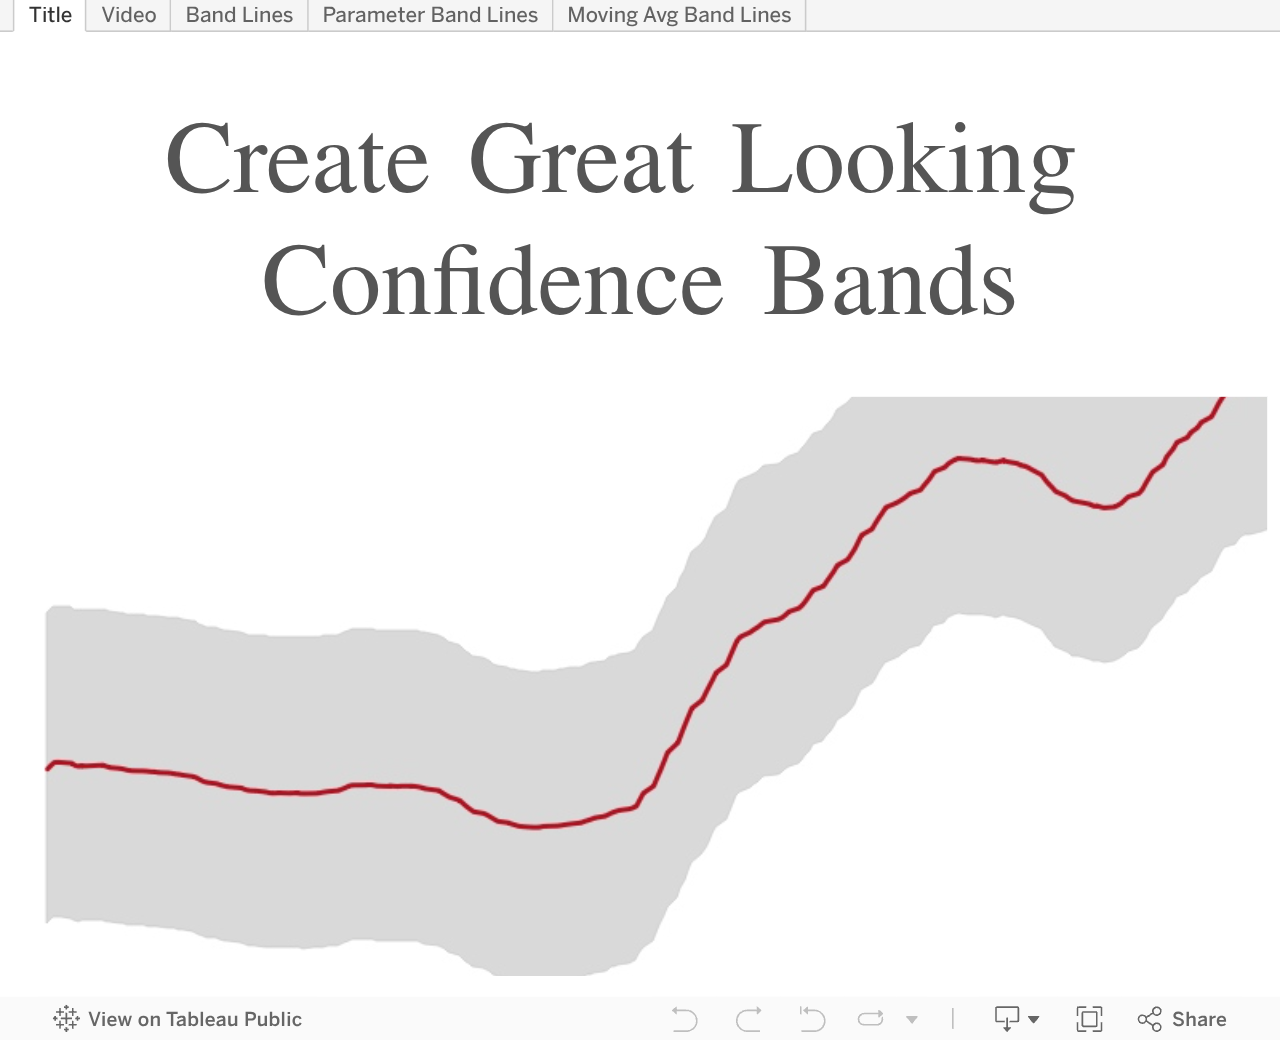
Tableau Tip Tuesday: Create Great Looking Confidence Bands

Back in February 2014 I wrote about creating Bollinger Bands. Today’s tip is a simplified, more practical version of this tip. This tip will help you to create bands lines that are quite visually pleasing to the consumers of your work.
In this video I focus on three topics:
In this video I focus on three topics:
- How to create confidence bands
- Using parameters to control the size of the confidence bands
- How to create a user-defined moving average based on a parameter
October 5, 2015
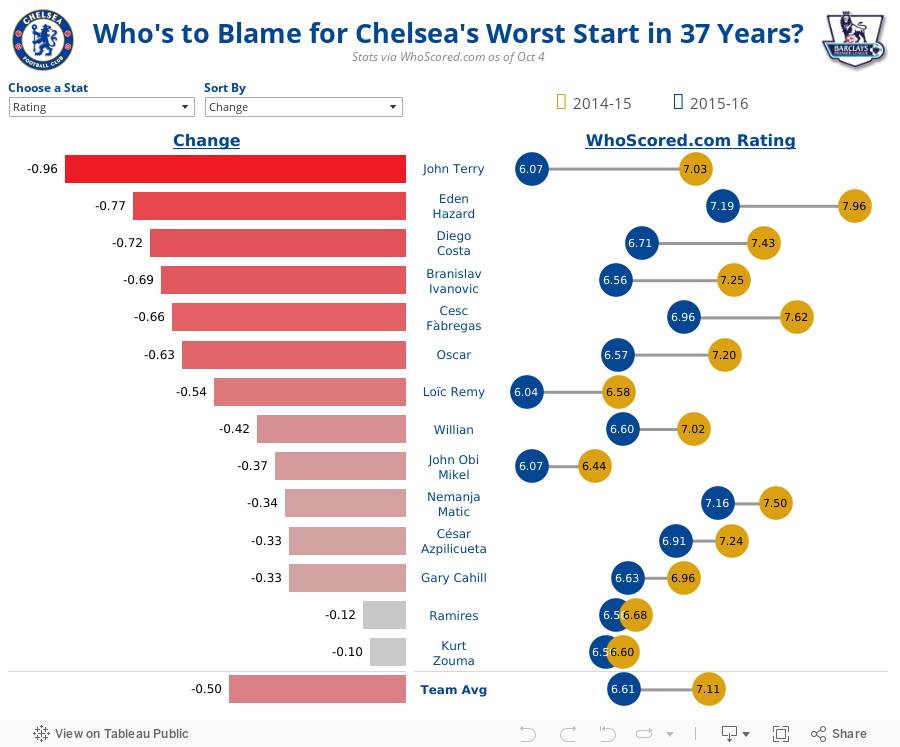
Who's to Blame for Chelsea's Worst Start in 37 Years?
Chelsea
,
EPL
,
football
,
Jose Mourinho
,
Premier League
,
soccer
,
stats

To say the start to Chelsea’s season has been a debacle would be a massive understatement. From an outsider, it seems fairly clear that Jose Mourinho has lost the dressing room. He even got the kiss of death today when the club released a statement giving him a vote of confidence.
It’s been interesting watch it unfold from this side of the pond. Mourinho is a media darling, even getting away without punishment from the FA and the club for his treatment of team doctor Eva Carneiro. After every loss he pushes the blame on someone other than himself. It’s likely only a matter of one more loss before he gets the sack.
Given all of Mourinho’s shortcomings as a manager this year, the ultimate proof comes in the form of his players’ performances on the pitch. So far this season, those performances have been downright dreadful. Just how bad has it been? The viz below shows that things are really, really bad.
I looked at three key stats from WhoScored.com: Player Rating, Pass Completion %, and Aerial Duals Won. I took the data and filtered it down to the outfield players that made contributions both last season and this. I then created the simple analysis below.
Some notes:
If things don’t turn around in the next fixture against Aston Villa, I wouldn’t be at all surprised if Jose got the sack. Why? Because you can’t fire 24 players at once and because Mourinho’s ego is too big to last more than three years at any club.
It’s been interesting watch it unfold from this side of the pond. Mourinho is a media darling, even getting away without punishment from the FA and the club for his treatment of team doctor Eva Carneiro. After every loss he pushes the blame on someone other than himself. It’s likely only a matter of one more loss before he gets the sack.
Given all of Mourinho’s shortcomings as a manager this year, the ultimate proof comes in the form of his players’ performances on the pitch. So far this season, those performances have been downright dreadful. Just how bad has it been? The viz below shows that things are really, really bad.
I looked at three key stats from WhoScored.com: Player Rating, Pass Completion %, and Aerial Duals Won. I took the data and filtered it down to the outfield players that made contributions both last season and this. I then created the simple analysis below.
Some notes:
- Every player has a lower rating this year than last. Particularly in poor form are Terry, Hazard, Costa and Ivanovic.
- Some of Chelsea’s most creative players are struggling to connect passes. Are the likes of Ramires, Oscar and Fabregas trying too hard under the pressure perhaps?
- Matic has been taking a lot of stick from Mourinho, but his pass completion % is 3.5% better than last year. He’s not being nearly as sloppy with the ball as his midfield counterparts, though if you read the papers you would think it was the opposite.
- John Terry is showing his age when it comes to aerial duals. He’s winning less than half as many as last year.
If things don’t turn around in the next fixture against Aston Villa, I wouldn’t be at all surprised if Jose got the sack. Why? Because you can’t fire 24 players at once and because Mourinho’s ego is too big to last more than three years at any club.
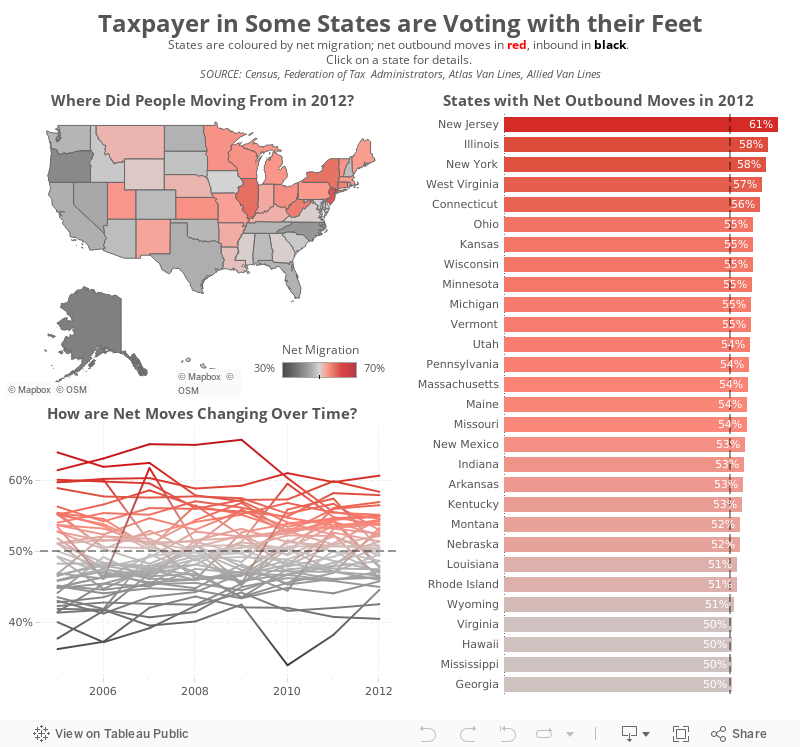
Makeover Monday: Taxpayer in Some States are Voting with their Feet
CNBC
,
color
,
context
,
John Schoen
,
Makeover Monday
,
map

John Schoen over at CNBC is a pretty regular Tableau user and it’s great to see Tableau being used in news organisations. However, I think he missed the mark with this visualisation about taxpayer migration in the US.
Let’s start with the squared map.
How about the scatter plot?
And the line chart?
One of the great things about Tableau Public is that most people allow you to download their workbooks so you can have a play for yourself. That’s exactly what I did in this case. I’ve build the dashboard below to address the communication issues that I feel the original has.
What did I do?
What would you do differently? I’d love your suggestions for making this better.
Let’s start with the squared map.
- While some might see this as cute, it’s quite poor at communicating effectively. It’s difficult to compare the size of the squares. The size legend is essentially useless.
- The colour scale is not colour-blind friendly. I suppose he’s going for a stop light type of look, but that’s not even what this is because it has four colours, not three.
- The placement of the squares is not geographically accurate.
How about the scatter plot?
- Again, why the squares?
- Same colour issues as the map, but at least it’s consistent with the map.
- The annotations he added work well and the reference line at 50% aids in understanding, but both of those are merely encoding the same measure as the colour scheme.
- What is the scatter plot adding that the map is not already showing us?
And the line chart?
- This works well for a single state, but what if I want to compare states? What if I want to see all states at the same time so that I can see if there are any common themes?
- The colour scale is not consistent with the other two charts. Click on California and you’ll see what I mean.
One of the great things about Tableau Public is that most people allow you to download their workbooks so you can have a play for yourself. That’s exactly what I did in this case. I’ve build the dashboard below to address the communication issues that I feel the original has.
What did I do?
- Focused on a single metric, in this case net migration, since that’s what the original story was about.
- Used a single colour pallet that is colour-blind friendly
- Added all states to the line chart. Clicking on a state in the map will highlight the state on the line chart.
- Included a bar chart of the states that have a net outward migration
- Gave the visualisation a more meaningful title
What would you do differently? I’d love your suggestions for making this better.
October 4, 2015
Dear Data Two | Week 24: Doors - How Colourful is My Neighbourhood?
bar chart
,
color
,
Dear Data Two
,
doors
,
Kingston
,
map
,
Mapbox
,
spaces
No comments

When I saw the topic for week 24, I immediately knew what I wanted to create. In California, our neighborhood was managed by a homeowner’s association, which meant uniformity everywhere, including every house door being black. One of the first things I noticed upon moving to our home in Kingston was how colourful the doors are.
Since there are so many homes on each street (townhouse/terrace style homes mostly), it was going to take quite some time to document all of the door colours. My wonderful daughter walked me with to help with the survey; I wrote down the door colours while she told me what they were. We got a few bizarre looks from people. Given that I was writing in a notebook as we looked at each house, it wasn’t too surprising.
When I started entering the data into Excel, I realized that I didn’t write down the house numbers. So out we went again for a second survey. After entering all of the data, I copied the addresses into Batch Geocoder to get the latitude and longitude for each address.
Next, I create a custom black and white Mapbox map for use in Tableau. I initially used a house shape for each house, but when I was showing this to people at the Data School, they thought it looked to cluttered, so I stuck with circles.
My postcard looks pretty similar to Tableau in terms of style. However, I think my postcard looks cleaner and simpler. I almost felt like an architect or city planner creating this map.
Enjoy!
October 3, 2015
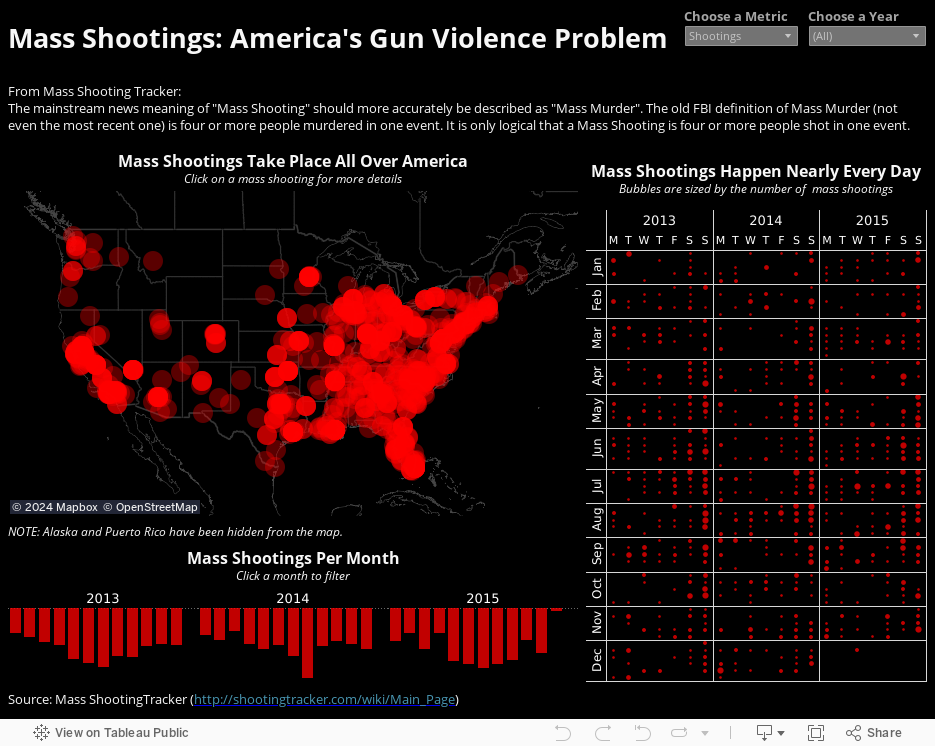
Mass Shootings: America's Gun Violence Problem
gun control
,
guns
,
map
,
murder
,
shooting
,
USA
2 comments

Another mass shooting in the USA. 17 more people shot. 10 dead. 7 wounded.
So what’s one to do? How about find some data and see if a visualisation can have an impact?
This morning, I woke up early thinking about the data. I didn’t want data about murders; I wanted data about shootings. Why? Because if shootings don’t occur, then gun murders can’t occur.
A Google search turned up the amazing website Mass Shooting Tracker. They’ve been collecting data about mass shootings since 2013. Their explanation of what and why they track what they do is critical:
The most obscene incidents of gun violence usually do not make the mainstream news at all. Why? Because their definition is incorrect. The mainstream news meaning of "Mass Shooting" should more accurately be described as "Mass Murder".I downloaded all of the data, parsed out the locations, loaded them into Batch Geocoding and viola…all the data I needed to build this viz.
The old FBI definition of Mass Murder (not even the most recent one) is four or more people murdered in one event. It is only logical that a Mass Shooting is four or more people shot in one event.
Here at the Mass Shooting Tracker, we count the number of people shot rather than the number people killed because, "shooting" means "people shot".
Subscribe to:
Posts
(
Atom
)


