October 31, 2018
Analyzing Pitcher Performance With Density Heatmaps
baseballsavant
,
clayton kershaw
,
density
,
heatmap
,
justin verlander
,
major league baseball
,
MLB
No comments
With Tableau 2018.3 comes density heatmaps, a feature I've been playing with quite a bit and love it for when I have a dense concentration of points and a regular scatterplot doesn't work well. Transparency can help with dense dots, but I think the heatmaps work much better.To give it a test, I downloaded every pitch for Clayton Kershaw and Justin Verlander (two of the best pitchers in Major League Baseball) from 2008-2018 from the great stats website Baseball Savant. Every time I look at baseball data, I'm amazed at the detail of the stats covered; the data far exceeds anything that is covered in other sports.
After downloading the data, I built the small multiples view below for each pitcher so that I could see their progression through the years. Click on the images for the interactive versions. I love how the data shows me how each pitcher has gotten better with their "misses" through their careers. For example, when they throw sliders for balls, they now tend to miss below the strike zone. This is a great sign that they have command of their pitches and are less likely to miss in an area where the batter can take advantage.
The density heatmap feature will most likely be used by most people on maps, which makes sense, but consider looking at it as an alternative whenever you need to plot x/y coordinates and have lots of points to display.


Makeover Monday: Women are more likely to always wash their hands after using the toilet
bathroom
,
hand washing
,
Makeover Monday
,
men
,
pee
,
poo
,
survey
,
toilet
,
women
,
YouGov
No comments

Anyway, onto the viz to critique:
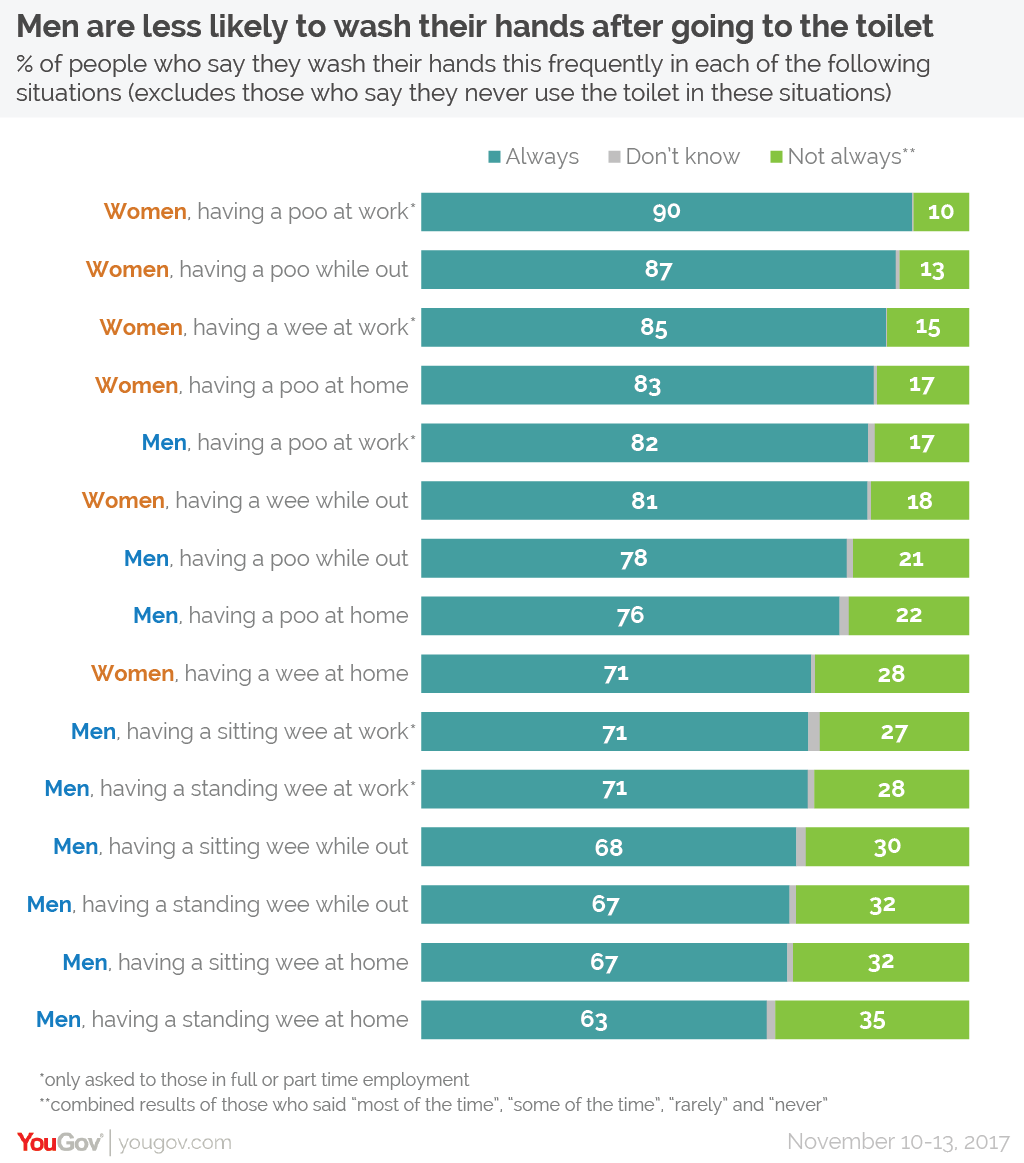
What works well?
- The design of the responses as a stacked bar chart is easy to understand.
- The responses are ordered from highest to lowest.
- Women and men are assigned difference colors in the text
- Good title and subtitles
- Colors are easy enough to distinguish
What could be improved?
- Comparisons between women and men in the same categories are hard to make
- Maybe there could be an easier way to distinguish between poo and pee
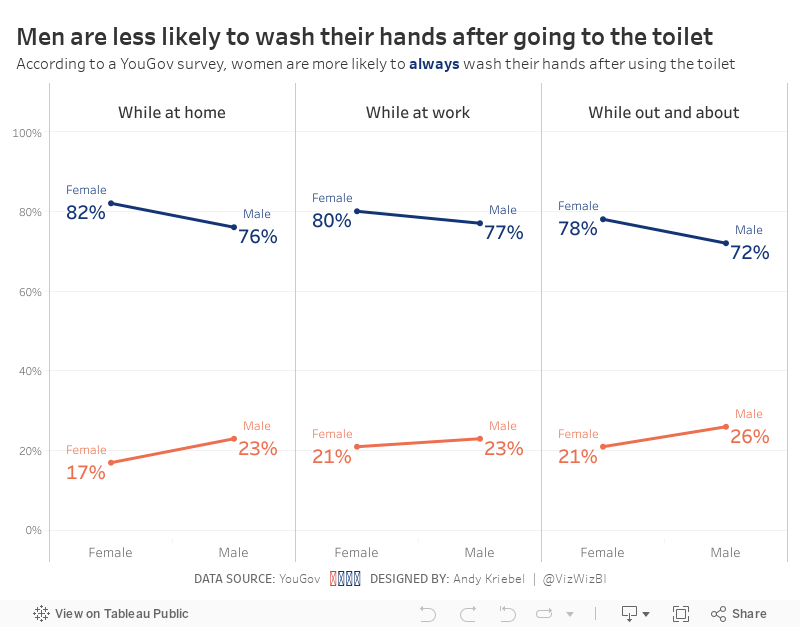
My Goals
- Do something quick (like 10 minutes); I'm late for MM for the first time ever, but it's ok because I'm on holiday with my Dad and Brother.
- Make the comparisons easier
- Use colors that are a bit easier to associate to the men and women categories
With that in mind, here's my Makeover Monday for week 44 2018.
October 24, 2018
Workout Wednesday: Where should we focus our sales effort?
#TC18
,
level of detail
,
LOD
,
map
,
table calc
,
Tableau Conference
,
Workout Wednesday
No comments
This week's Workout Wednesday was a live edition at TC18 hosted by Ann Jackson and Luke Stanke. You can get the challenge requirements here. I worked with Lorna Eden (former Data Schooler) and we nearly finished in the allocated time; the only part we could get quite right was the shapes.I headed back to my hotel room after the session because I had to finish it (plus I have a presentation to work on). What we did wrong was quite a dumb oversight. In the calculation to create the shapes, we were using the wrong dimension. How dumb of us!
Anyway, we're done now. It was really fun to try to get it done in 50 minutes. So close!
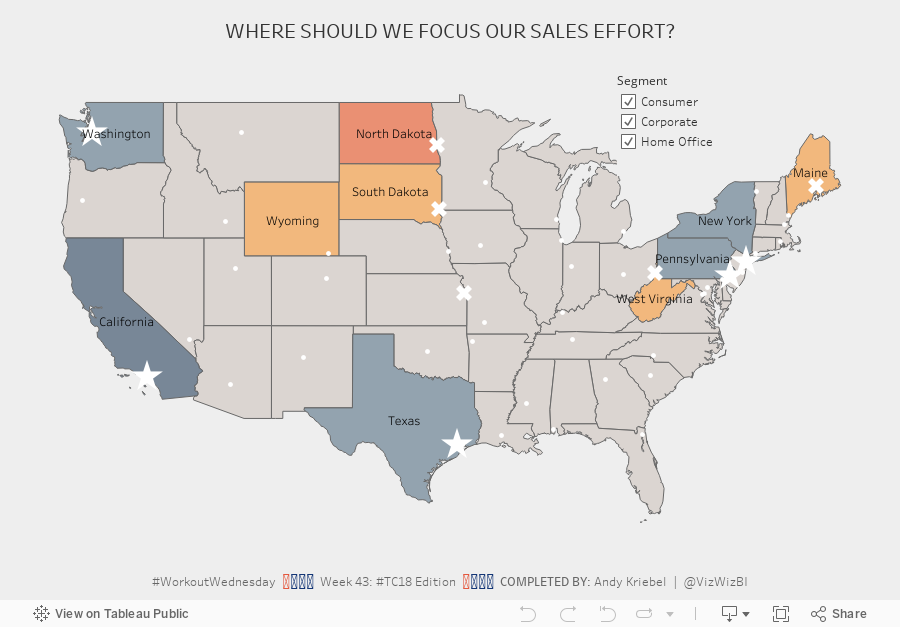

Tableau Speed Charting: 50 Charts in 50 Minutes
charts
,
Jeffrey Shaffer
,
tableau
,
TC18
,
tips
,
tricks
No comments
Yesterday at TC18, I had the pleasure presenting with Jeff Shaffer for the fourth year in a row. Three years ago we presented about Dear Data Two, the past two years we had a tips battle, and this year we decided to switch it up and see how many charts we could build in 50 minutes.We think we made it through about 70 charts, some of those by Jeff were incredible and had never seen before. The recording will be released by Tableau a couple weeks after the conference ends.
Click on the image below (or here) to download the workbook with all of my charts.

October 22, 2018
Makeover Monday: Historical Major League Baseball Beer Prices
baseball
,
beer
,
highlight
,
major league baseball
,
Makeover Monday
,
MLB
,
small multiples
,
team marketing report
No comments

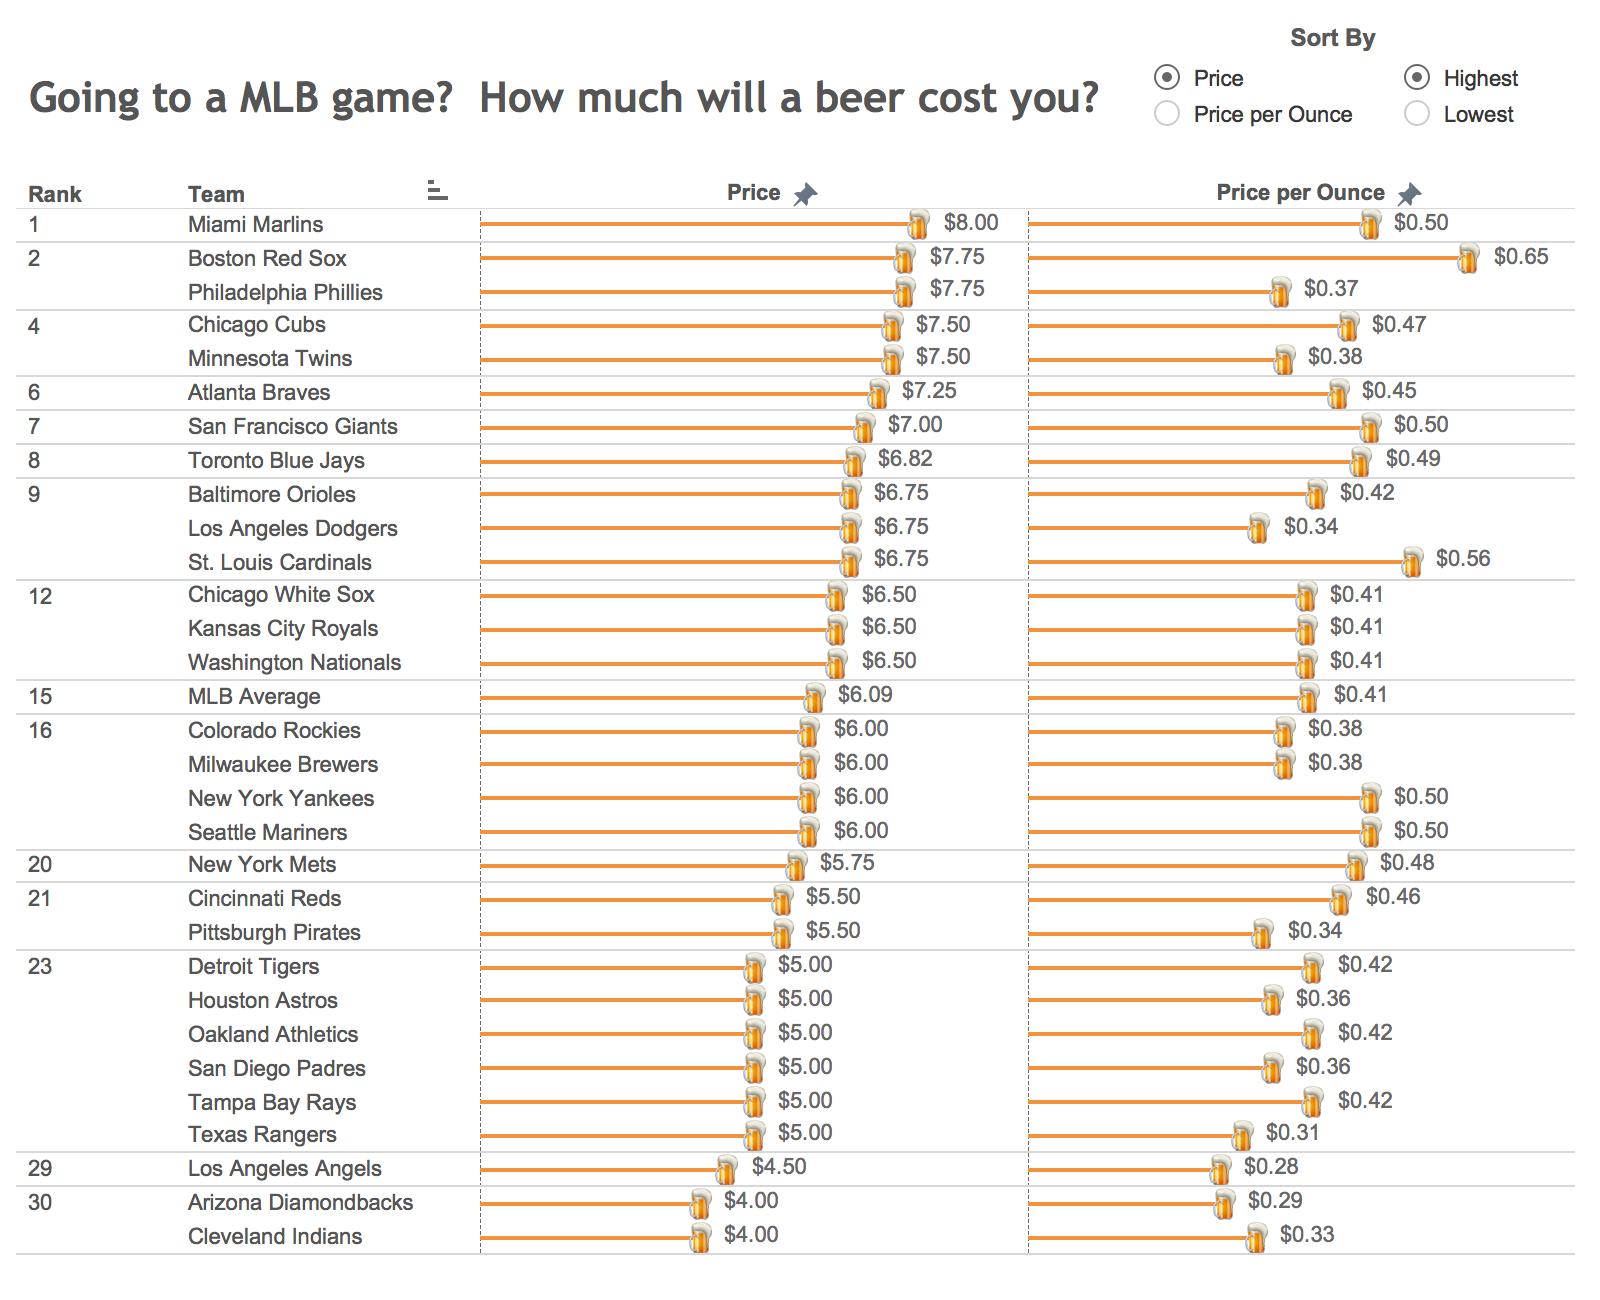
What works well?
- The title is clear and tells the reader what the data is about.
- The user can sort the data based on their preference.
- The placement of the sort options encourages interaction.
- The rank helps show where a team falls amongst the league.
- The color of the bars goes with the beer theme.
What could be improved?
- The data source is not listed.
- Having so labels on the end of every bar makes the viz too busy.
- The beer mug icons are completely unnecessary.
- The font looks very small.
What did I do?
- The new data set has data for 2013-2018 (except 2017), so I wanted to make sure I looked at the data over time.
- Made the title more descriptive so that the user (hopefully) understands what the line represents.
- I borrowed several techniques I learned from Workout Wednesday week 41:
- Shading those that have increased prices vs. 2013 with a red background
- Labeling the top middle with the team and the latest price
- Labeling the end of each line; in WW the labels were all placed on the lower-right of each pane, but I didn't like how it looked in this case
- Ordered the teams from highest to lowest based on the latest price
- Organized the team in a trellis format so they fit nicely into a 6x5 grid
- Included the data source. my name, and the inspiration for the design
And here's my Makeover Monday week 41. Click on the image for the interactive version. I can't wait to see what everyone creates at MM Live!
October 17, 2018
Tableau Tip Tuesday: 82 Charts in 80 Minutes
charts
,
Data School
,
Information Lab
,
Let's Talk Data
,
meetup
,
tips
,
tricks
,
webinar
No comments
If you're not a part of The Information Lab's new Meetup group Let's Talk Data, then you're missing out on some great opportunities for FREE learning. Join the group to get all of the latest information. We host many events at the new home of The Data School in London and webinars anyone can join from anywhere in the World.Monday, I ran a free Tableau Zen Master Tips & Tricks webinar. I changed it from the previous webinars I ran last year; this time I focused on charts. I wanted to see how long it would take me to build 82 charts. It took a little under 80 minutes. This was a rehearsal of sorts for the Tableau Speed Charting session Jeff Shaffer and I are running at TC18.
Click on the image below to access the workbook with all of the chart types. I've also embedded the video from the session in the "Video" tab. Enjoy!

October 16, 2018
Tableau Public: The Heart of the Tableau Community


When Tableau Public launched back in 2010, I had no idea how much it would change Tableau the product, Tableau the Community, and me personally. The impact on how people see and understand data would not be what it is today without Tableau Public. I'm 100% convinced of that. Why?
Tableau Public is the heart and soul of Tableau. Tableau Public is THE BOND that holds the Community together. Tableau Public is THE PLATFORM for sharing our work. Tableau Public is THE SOURCE for getting inspiration from others.
Without Tableau Public, learning, sharing, and exploring would be significantly more challenging.
COMMUNITY PROJECTS
Without Tableau Public, there would be no Makeover Monday. There would be no Makeover Monday book. There would be far less people improving their skills week by week. There would be far less engagement within in the Community. The thousands of people that have participated, never would have engaged. If there was no Tableau Public, would these people have ever found Tableau?
Without Tableau Public there would be no Viz for Social Good. There would be no Workout Wednesday. There would be no Sports Viz Sunday. Without Tableau Public there would be far fewer people practicing data visualization and data analysis week after week through these Community projects.
Without Tableau Public there would far fewer friendships born out of a common love for data. There would be far fewer people finding the careers they love.
Without Tableau Public, would there be a Tableau Community?
BUILDING A PORTFOLIO
Picture this: you've purchased a new office and need to hire a designer to help you make the space yours. How would you go about hiring this person? Would you scan LinkedIn and look for people with the title "Interior Designer" or look for people that went to design school? Of course you wouldn't. You would ask to see their portfolio. Imagine a designer coming in to meet you and not bringing a portfolio of their work. Would you hire them? Of course not. You're interested in WHAT they've done, not where they went to school. Their portfolio IS their CV.
From a Tableau perspective, Tableau Public is the new CV. The secret to hiring people that are great at Tableau is to look at their Tableau Public profiles. If someone doesn't have a Tableau Public profile, don't hire them. Those people, more often than not, don't understand the ethos of the Tableau Community. And if they aren't part of the Community, I would seriously question their skills. How can you evaluate their work if they don't have a portfolio? Simple...you can't!
Eva and I have been asking people to tell us how Makeover Monday has helped them get a job they love. Person after person has told us that their Tableau Public profile was the major differentiator for them getting the job. People have been able to DEMONSTRATE their work, live in front of those interviewing them. They've been able to prove they have the skills needed for the role. Those companies may have asked for a CV, but what really mattered to them was WHAT people have done.
Through Tableau Public, you can see the progression of someone's skills. You want to look for people that have clearly shown improvement. Without Tableau Public, how would any of these people have been able to show their progression?
DEVELOPING SKILLS
Tableau Public is a platform that allows you to practice. You can build chart types you have never built before. You can practice data analysis, storytelling and design. Without Tableau Public to inspire each other, how would we know where we need to develop?
The development of these skills allows you to showcase your work. Having Tableau Public to share you work helps others see your passion and the quality of your work. It's this combination of passion and quality that distinguish high performers from others. Without Tableau Public, how would people showcase their work?
The development of these skills allows you to showcase your work. Having Tableau Public to share you work helps others see your passion and the quality of your work. It's this combination of passion and quality that distinguish high performers from others. Without Tableau Public, how would people showcase their work?
MY PERSONAL IMPACT
What has Tableau Public meant to me? First and foremost, it's been a way for me to share what I'm learning. Yes, I write about each technique on this blog, but I can actually share the workbooks and the techniques by uploading the workbooks to Tableau Public and allowing people to download them, try to recreate them, whatever they want to do with them. Tableau Public, the platform, encourages sharing and I'm grateful that Tableau Public has provided me with that opportunity.
Tableau Public completely changed my life. If I didn't have a Tableau Public profile, I would not have gotten my job at Facebook. If I didn't have my Tableau Public profile, would Tom Brown have taken a chance on me to run The Data School? I'll never know, but I'm certain that Tableau Public exposed me to these opportunities. When I share, I expect nothing in return. When you share freely, opportunities will come to you as they have to me.
Without Tableau Public, I would not have been able to travel the world introducing people to Tableau for the first time. Tableau Public allows me to show people what is possible in Tableau. All I need to do is show them the Tableau Public gallery. People think we're all crazy for this addiction we have to Tableau. I'm perfectly ok with that because I know Tableau Public provides me an opportunity to learn every day.
That leaves me with only one thing to say...thank you Tableau Public. Here's to many more years.
October 15, 2018
Makeover Monday: The Under-representation of Women in the House of Representatives
Congress
,
democrats
,
female
,
gender
,
House of Representatives
,
inequality
,
Makeover Monday
,
republicans
,
women
No comments

Let's have a look at Stephen's viz:

What works well?
- It's simple and easy to understand.
- Nice and clean; there's no unnecessary decoration
- Using colors that represent the parties
- Using a line chart to represent change over time
- Labeling the end point makes us aware of the current situation
What could be improved?
- The stepped lines are necessary.
- The ratio of the chart looks strange to me.
- The title could be more impactful.
- Adding a y-axis would add context.
What I did
- Focus on the % of women and men in each party
- Use the party colors, but still be able to distinguish men and women
- Use a line to break up the area chart
- Use an impactful title and subtitle
- Use a viz in tooltip to show BANs
With that, here's my Makeover Monday for week 42. Click on the image for the interactive version:
October 12, 2018
Workout Wednesday: Top & Bottom Highlights
area chart
,
highlight
,
labels
,
level of detail
,
line chart
,
LOD
,
parameter
,
small multiples
,
table calc
,
Workout Wednesday
No comments
What a super useful workout this week from Ann Jackson! Get all of the requirements here. The idea was to build a dashboard that allows the user to highlight the top and bottom panes based on a set of options. There are so many use cases for this in a business setting.The Easy Parts
- Creating the small multiples layout
- Limiting the data to 2017/2018. I chose to do this via a data source filter so that I didn't have to worry about adding the date field as a filter and add it to context.
- Creating the line chart
- Formatting the axis properly
- Creating the calculation needed for the shading (I approached it by doing one of the top calculations, then one of the bottom calculations, then the combined)
- Creating the total sales text at the top-center of the chart
The Biggest Challenge
- I knew I had to calculation right for the label for the latest month, but for the life of me I couldn't get it working. I felt like I needed another axis for the mark, then it dawned on me like a slap in the face how simple the solution is.
Here's a gif of the working solution. Click on the gif for the interactive version.

October 7, 2018
Makeover Monday: Five-year Cancer Survival Rates in America
America
,
big numbers
,
cancer
,
line chart
,
Makeover Monday
,
our world in data
,
rates
,
reference band
,
sparklines
,
survival
,
United States
,
USA
No comments

Here's the original viz:
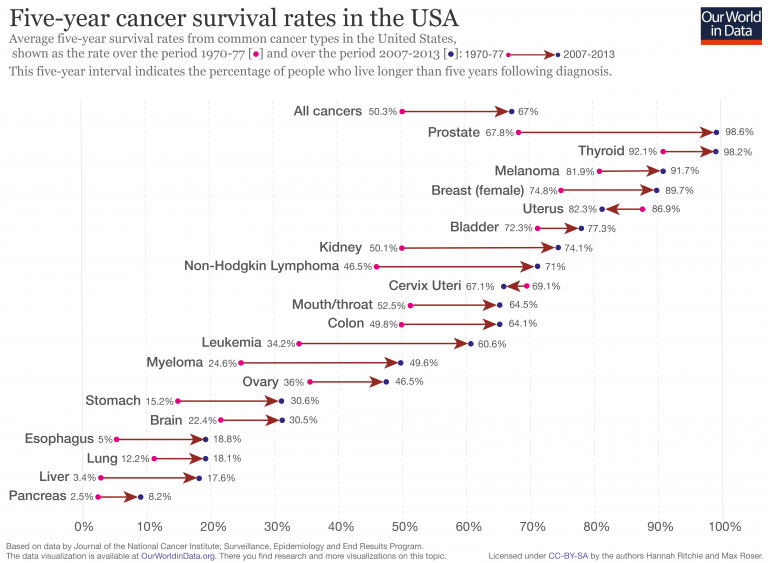
What works well?
- Simple title that explains what the viz is about
- Cancer types are sorted from highest to lowest based on the five-year survival rate
- "All cancers" is sorted at the top since it's the overall statistic
- Using arrows to indicate improving or declining
- Using different colored dots for each time period
- Including an explanation for how the data came about
What could be improved?
- The subtitle is long. I had to read it a couple times to understand it.
- The viz overall feels kind of busy.
- By using directional arrows, the change over time is lost. The change isn't linear, but the design could be interpreted that way.
- Color the arrows by increasing or decreasing. Uterus and Cervix Uteri cancer survival rates have decreased, but that could easily be missed.
What I did
- Incorporatde the change over time
- Used BANs for the first period and the last period measured and the difference
- Used a big dot to indicate a reduction in survival rate
- Used row banding to guide the eye from left to right (taking a lesson from last week's Workout Wednesday)
- Provided an option to filter by race and gender
- Used a set to split the view into the top 9 on the left and the rest on the right; my first version was one long viz, but I didn't like how I had to scroll.
- Used reference bands vertically and horizontally to give the labels space on the ends of the lines
Click on the image below for the interactive version.
October 4, 2018
Workout Wednesday: Where are Sub-Category Sales Down?
alert
,
formatting
,
indicator
,
KPI
,
modulo
,
padding
,
table
,
table calc
,
Workout Wednesday
No comments
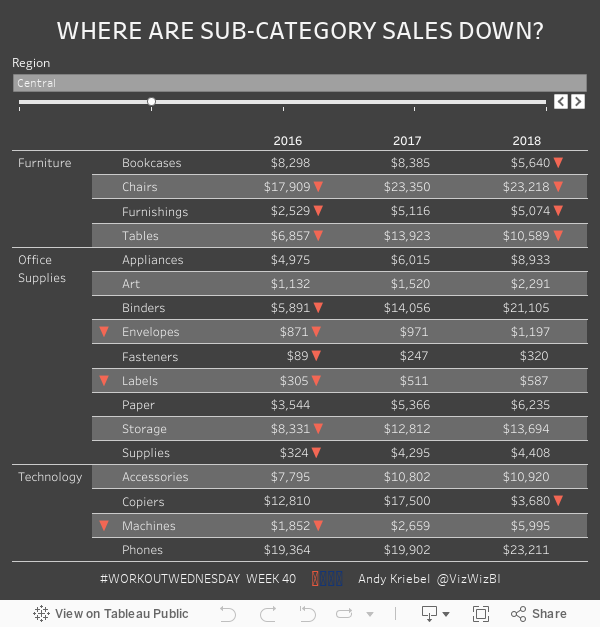
Three weeks in a row now! Feels like I'm on a roll. This week, Luke challenged use to create an actionable table which alerts users to the problem areas very quickly. This is a neat way to get people to begin the journey from Excel tables to interactive visualizations.Read all of the requirements here.
Some thoughts:
- I had used a lot of the tricks before, so I had an idea where to start. This video should be helpful for the indicators.
- I ended up using the modulo function along with an INDEX table calc to find the odd and even numbered rows so that I could format all of the text correctly.
- Getting the year to align correctly with the numbers was the toughest part. I could tell by looking at the viz that the text was centered, yet it was made to look like it was right-aligned. Therefore, I had to come up with a solution for padding the text on the left for smaller numbers. I won't give away how I did it.
Really good challenge. I particularly enjoy the workouts that have practical use cases for every day work. Thanks Luke for the challenge!

October 2, 2018
Storytelling With Data Challenge: Annotated Line Graph
annotated line chart
,
annotation
,
challenge
,
Cole Nussbaumer
,
Knaflic
,
line chart
,
stock
,
storytelling with data
,
tableau
No comments
For those unaware, Cole Knaflic runs a monthly data viz challenge over on her website. These are a great way for you to flex your data viz muscles. I haven't participated yet, until now!I'm going all the way back to her first challenge in January: Annotated Line Graph. For me, it's been tough to learn the balance between enough text for context and too much that overwhelms. I feel like I'm splitting the difference here, by highlighting the highs and lows of Tableau's stock price.
Thanks for the challenge Cole! Click on the image for the interactive version.

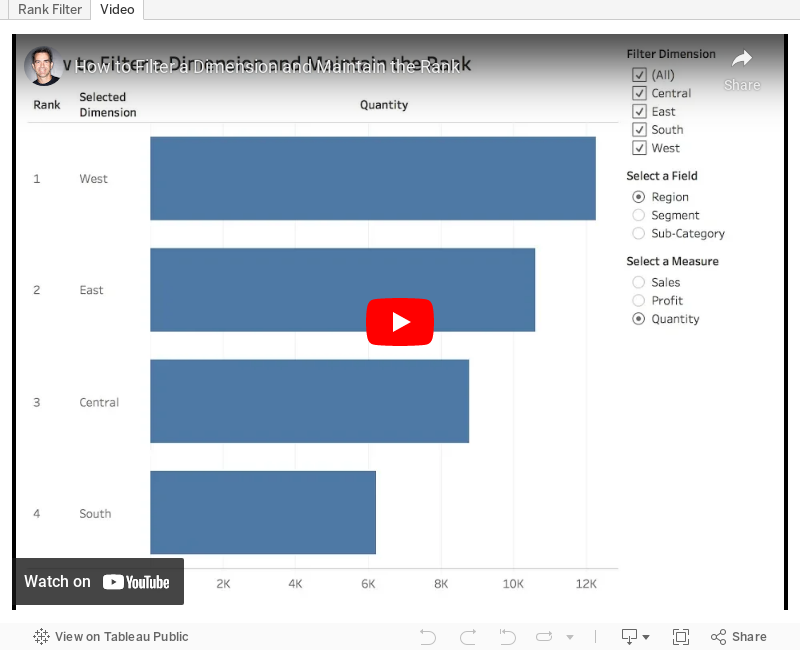
Tableau Tip Tuesday: How to Filter a Dimension and Maintain the Rank
This tip is inspired by Craig Bloodworth, CTO of The Information Lab and Tableau Zen Master Hall of Fame member. Craig demonstrated this when an attendee at our Zen Master session asked how you can filter a dimension and maintain the rank.I gave one solution which would show and hide dimensions, but Craig's is way way better. It's a neat way of using table calcs to filter a dimension since a table calc filter happens AFTER other table calcs are computed.
Also, in the video I reference our new meetup, Let's Talk Data. If you're in London, there will be tons of events at the new home of The Data School. If not, don't fret! We have some virtual events as well.
With that, here's the how you can filter a dimension and maintain the rank.

October 1, 2018
Workout Wednesday: Vertical Label and 3 Mark Types
area chart
,
ascii
,
line chart
,
mark type
,
parameter
,
shading
,
vertical label
,
Workout Wednesday
No comments
For Workout Wednesday week 39, Rody challenged the Community to create a shaded area chart with a line on top and marks for each month. That's three mark types, but Tableau only supports two at a time. In addition, the axis label has to be vertically aligned, that is, each letter in the word has to be below the preceding word.I was expecting some crazy polygon calculations from Rody, and perhaps that's how he approached it. I, however, was able to create the required view with only two marks and the text shelf. Before I get to how I came up with my solution, here's my submission:

For the dashboard layout:
- I used a vertical container with a 50px blank on each side.
- The rest of the viz is in a horizontal container in the middle of the vertical container.
- I added spacing to the outside edges of the black line to get the spacing right.
- I added some spacing at the top of the parameter and the dynamic title.
- The parameter is in a horizontal container with a blank on either side set to distribute evenly.
For the chart:
- I used an area chart on one axis.
- I used a line chart on the other axis.
- I used an ascii ● as a label on each mark on the line. This has to be centered vertically and horizontally for it to appear in the correct place for each month.
- For the vertical label, I used this knowledge base article to add a line break after each letter. Since there are 8 letters max, my formula has 8 lines and then I trim the text.

I'm sure there's a better way to do the vertical labels using the length of the string, but this works. In programming, I'd use a WHILE loop. Thanks Rody!
Subscribe to:
Posts
(
Atom
)


